
Coinbase Stock Plunges 4.61% to $244.20 Amid Bearish Technical Breakdown
Generated by AI AgentAinvest Technical Radar
Thursday, Jun 5, 2025 6:22 pm ET2min read
COIN--
Candlestick Theory
Coinbase Global exhibits bearish momentum as evidenced by the recent consecutive down-days, including a 4.61% decline on June 5 closing at $244.20. This session formed a long upper wick (high: $265.65), signaling rejection near the $265–$270 resistance zone—a level that capped prices in late May. Earlier, a bullish engulfing pattern on May 13–14 hinted at upside potential, but failure to sustain above $270 triggered distribution. Immediate support lies at $240 (May 30 and June 2 lows), while $215–$220 (April swing low) offers stronger historical support.
Moving Average Theory
The 50-day EMA ($258) crossed below the 100-day EMA ($262) in early June, confirming a bearish near-term trend. The 200-day SMA ($220) slopes upward, suggesting residual long-term bullishness. However, the current price ($244.20) trades below all three key MAs, indicating persistent selling pressure. A sustained break below the 200-day SMA may accelerate declines, while recovery above the 50-day EMA is needed to negate bearish control.
MACD & KDJ Indicators
MACD (-7.5) resides deeply negative with a widening histogram, reinforcing bearish momentum. KDJ reflects oversold conditions (K: 14.3, D: 18.7, J: 5.5) but shows no bullish crossover, suggesting momentum remains weak. While KDJ hints at exhaustion after two sharp down-days, MACD divergence underscores the absence of reversal confirmation.
Bollinger Bands
June 5’s close below the lower Bollinger Band ($247) signals an oversold extreme. Band width expanded sharply (+18% vs. prior day), reflecting volatility breakout. Historically, such events preceded short-term rebounds (e.g., April 22, March 19), but high-volume rejections near the lower band—like June 5—often precede extended consolidations.
Volume-Price Relationship
The 11.92M shares traded on June 5 marked a 98% surge vs. the 10-day average, validating bearish conviction. Earlier rallies (e.g., May 13–16) saw volume expansion, confirming upside participation. Recent distribution phases (May 28–30, June 4–5) consistently occurred on above-average volume, signaling institutional selling. Declines with rising volume increase the probability of continued downside.
Relative Strength Index (RSI)
Daily RSI (28.9) entered oversold territory (<30), historically coinciding with minor reversals (see March 21, April 9). However, oversold readings during strong downtrends (e.g., Jan 7, RSI: 27) preceded further declines. Given the bearish volume confirmation, RSI’s oversold signal may reflect transient exhaustion rather than a reversal catalyst.
Fibonacci Retracement
Using the primary uptrend from $147.35 (Sept 6, 2024) to $343.62 (Dec 6, 2024):
- 38.2% retracement: $215.13 (strong historical support; tested in April)
- 50% level: $245.48 (current price breaches this)
- 61.8% level: $275.87 (recent resistance)
The breach below the 50% Fib aligns with bearish MA crosses, targeting the 38.2% level ($215).
Confluence and Divergence
Confluence: Bearish signals align at $245–$250: 50% Fib breach, death cross (50/100-day EMA), volume-backed resistance, and upper Bollinger Band rejection.
Divergence: RSI and KDJ show oversold extremes against accelerating price declines—a potential early-warning sign of selling exhaustion, though unconfirmed by MACD or volume reversal.
Conclusion
Coinbase Global’s technical structureGPCR-- favors further downside toward the $215–$220 support confluence (200-day SMA, 38.2% Fib), following the high-volume breakdown below key moving averages and Fibonacci levels. Oversold oscillators (RSI, KDJ) hint at near-term consolidation or relief rallies, but sustained recovery requires reclaiming $258 (50-day EMA) with volume confirmation. Given indicator alignment, the path of least resistance remains downward short-term.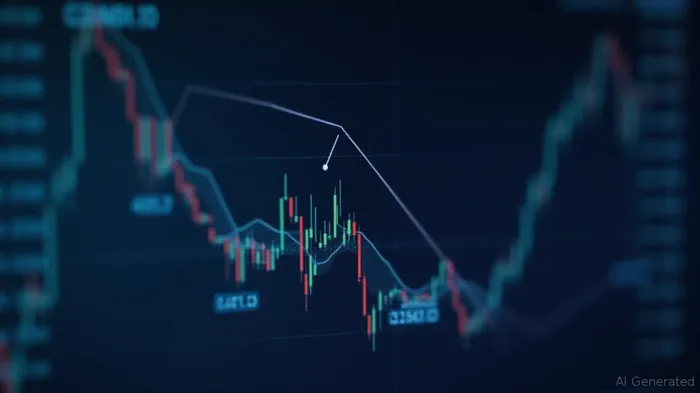
If I have seen further, it is by standing on the shoulders of giants.
Latest Articles
Stay ahead of the market.
Get curated U.S. market news, insights and key dates delivered to your inbox.
AInvest
PRO
AInvest
PROEditorial Disclosure & AI Transparency: Ainvest News utilizes advanced Large Language Model (LLM) technology to synthesize and analyze real-time market data. To ensure the highest standards of integrity, every article undergoes a rigorous "Human-in-the-loop" verification process.
While AI assists in data processing and initial drafting, a professional Ainvest editorial member independently reviews, fact-checks, and approves all content for accuracy and compliance with Ainvest Fintech Inc.’s editorial standards. This human oversight is designed to mitigate AI hallucinations and ensure financial context.
Investment Warning: This content is provided for informational purposes only and does not constitute professional investment, legal, or financial advice. Markets involve inherent risks. Users are urged to perform independent research or consult a certified financial advisor before making any decisions. Ainvest Fintech Inc. disclaims all liability for actions taken based on this information. Found an error?Report an Issue

Comments
No comments yet