
Coherus Oncology (CHRS) Plunges Nearly 20%: A Brutal Liquidation Event in the Oncology Sector
 Aime Summary
Summary
• Coherus OncologyCHRS-- (CHRS) shares plummeted 19.66% intraday, closing at $1.165, marking a severe capitulation event.
• The stock traded within a wide volatility band, hitting an intraday low of $1.135 against a previous close of $1.45.
• Institutional selling pressure intensified, with holdings decreasing by 29.67% quarter-over-quarter, signaling a major shift in smart money sentiment.
• Despite a 'Buy' consensus from analysts with a $7.25 target, the immediate technical structure has been violently broken.
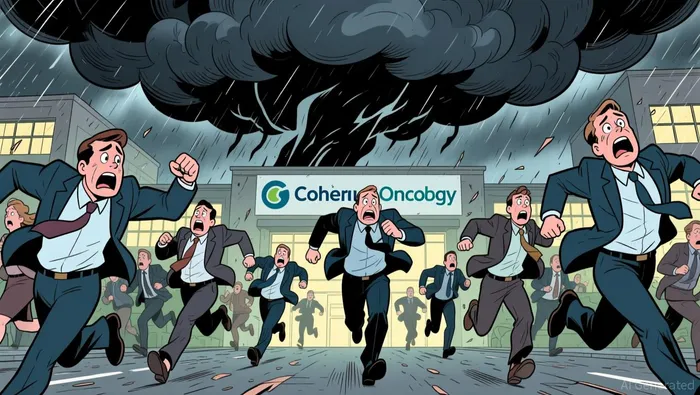
Today’s session witnessed a dramatic unwinding of positions in Coherus Oncology, as the stock shed nearly a fifth of its value in a single trading day. The move from the previous close of $1.45 to the current $1.165 represents a decisive break in short-term momentum, driven by heavy turnover of over 2.88 million shares. While the broader pharmaceutical sector remains mixed, CHRSCHRS-- has isolated itself in a steep downtrend, leaving investors to reassess the near-term trajectory of this immuno-oncology play.
Institutional Exodus and Technical Breakdown Trigger Sell-Off
The precipitous decline in Coherus Oncology is not merely a reaction to broader market sentiment but is structurally linked to significant institutional rebalancing and technical failure. Data indicates that institutional holdings have decreased by 29.67% quarter-over-quarter, a massive reduction that suggests large funds are exiting their positions. This selling pressure overwhelmed any potential support from the company's fundamental pipeline, including its approved PD-1 inhibitor LOQTORZI and the clinical-stage CHS-114 candidate. Furthermore, the stock’s performance is heavily influenced by its current valuation metrics; with a dynamic P/E ratio of -1.53 and a market cap of $179.66 million, the stock is highly sensitive to liquidity shifts. The absence of positive catalysts in the immediate news cycle, coupled with the heavy institutional outflow, created a vacuum that allowed sellers to drive the price down to the $1.135 intraday low, effectively breaking the short-term bullish trend.

Pharmaceutical Sector: Sector Leader PFE Outperforms as CHRS Diverges
While the broader Pharmaceutical sector showed resilience today, led by sector leader Pfizer (PFE) which posted a modest intraday gain of 0.62%, Coherus Oncology moved completely independently in a bearish direction. This divergence highlights that the selling pressure on CHRS is idiosyncratic rather than systemic. Unlike large-cap peers such as Amgen (AMGN) or Biogen (BIIB) which maintained stability, CHRS’s -19.66% drop underscores a specific lack of confidence in its near-term liquidity and institutional backing. The sector news, which focused on broader M&A activity like the AstraZeneca-BMS talks and FDA approvals for other entities, provided no tailwinds for CHRS, leaving it exposed to its own internal supply-demand imbalances.
Bearish Breakout Strategy: Technical Levels and High-Leverage Option Plays
The technical picture for Coherus Oncology is currently dominated by bearish momentum, with the stock trading well below key moving averages. The breakdown below the 20-day, 50-day, and 200-day moving averages confirms a long-term bearish trend that has recently accelerated. Traders must watch the immediate support levels closely, as the stock has lost all short-term structure.
• 200-day Moving Average: $1.595 (Price is significantly below; indicates long-term downtrend)
• 50-day Moving Average: $1.477 (Price is below; confirms intermediate-term weakness)
• RSI (14): 56.52 (Neutral; suggests room for further downside before extreme oversold conditions)
• MACD Histogram: 0.0044 (Positive but weak; signal line crossover remains bearish overall)
• Bollinger Bands Lower: $1.344 (Price has broken well below the lower band; indicates extreme volatility and potential mean reversion risk)
The stock is currently trading at $1.165, far below the 30-day resistance range of $1.435–$1.440. The immediate outlook is bearish, with the stock likely to test lower liquidity zones. Given the high volatility (ATR 14: 0.066), options offer asymmetric risk profiles for aggressive traders. We identify two contracts from the provided chain that offer high leverage and liquidity suitable for this volatile environment.
Contract 1: CHRS20270219P1.5CHRS20270219P1.5--
• Contract Code: CHRS20270219P1.5
• Type: Put Option
• Strike Price: $1.50
• Expiration Date: 2027-02-19
• Key Stats: IV 43.82%, Leverage 3.36%, Delta -0.6976, Theta -0.000061, Gamma 0.9202, Turnover 0
• Stat Interpretation: IV (Volatility Cost), Leverage (Multiplier Effect), Delta (Price Sensitivity), Theta (Time Decay), Gamma (Acceleration of Delta), Turnover (Liquidity Volume).
This contract stands out due to its high Gamma (0.9202), indicating extreme sensitivity to price movements, and a Delta of -0.6976, providing substantial downside exposure. Although turnover is currently low, the high Gamma makes it highly responsive to any further drops. The 43.82% IV is moderate, balancing cost and protection.
Contract 2: CHRS20270219C0.5CHRS20270219C0.5--
• Contract Code: CHRS20270219C0.5
• Type: Call Option
• Strike Price: $0.50
• Expiration Date: 2027-02-19
• Key Stats: IV 294.13%, Leverage 1.38%, Delta 0.9318, Theta -0.000875, Gamma 0.0517, Turnover 255
• Stat Interpretation: IV (Volatility Cost), Leverage (Multiplier Effect), Delta (Price Sensitivity), Theta (Time Decay), Gamma (Acceleration of Delta), Turnover (Liquidity Volume).
This contract offers deep intrinsic value with a Delta of 0.9318, acting almost like a short stock position. While the IV is extremely high (294.13%) and leverage is low (1.38%), the high Gamma (0.0517) and turnover (255) suggest it is the most liquid call option available. It is suitable for traders betting on a sharp, immediate bounce or recovery from the $1.165 level.
Payoff Calculation Primer: In a 5% downside scenario (Price drops to ~$1.107), the CHRS20270219P1.5 Put Option would have a payoff of max(0, 1.50 - 1.107) = $0.393 per share. The CHRS20270219C0.5 Call Option would have a payoff of max(0, 1.107 - 0.50) = $0.607 per share.
If $1.135 breakdown holds, CHRS20270219P1.5 offers significant short-side potential with high Gamma acceleration.
Immediate Action: Brace for Volatility and Monitor Support Breaks
The current move in Coherus Oncology is likely to remain volatile and biased to the downside in the short term, given the heavy institutional selling and technical breakdown. Investors should not attempt to catch the falling knife until the stock stabilizes above the $1.135 intraday low. The key signal to watch is whether the stock can reclaim the $1.344 Bollinger Band lower bound; failure to do so will likely extend losses toward the 52-week low of $0.825. In contrast, the broader pharmaceutical sector leader, Pfizer (PFE), gained 0.62%, highlighting that safety lies in established names rather than speculative oncology plays during liquidity crunches. Watch for a sustained hold below $1.135 or a relief rally above $1.30 to determine the next directional bias.

TickerSnipe provides professional intraday stock analysis using technical tools to help you understand market trends and seize short-term trading opportunities.
Latest Articles
Stay ahead of the market.
Get curated U.S. market news, insights and key dates delivered to your inbox.


AInvest
PRO
AInvest
PRO




Comments
No comments yet