
CNPY Rebounds Sharply After Intraday Liquidation
 Aime Summary
Summary
- CNPYUSDT exhibits extreme volatility with a 24-hour range spanning from 0.16865 to 0.22501.
- A significant volume spike at 06:00 UTC triggered a sharp reversal from lows near 0.171.
- Price action suggests a potential mean reversion phase following the recent steep decline.
- Bullish engulfing patterns indicate buying pressure emerging after the intraday liquidation event.
- Traders should monitor the 0.22501 high as immediate resistance for further upside potential.
Volatile Recovery Phase
Canopy/Tether (CNYUSDT) experienced high volatility on September 10, 2026, with the latest hourly candle closing at 0.22461. The asset recorded a 24-hour trading volume of approximately 16.9 million USDT. The market structure shows a sharp dip followed by a strong intraday recovery attempt.
1-Hour Support/Resistance and Candlestick Patterns
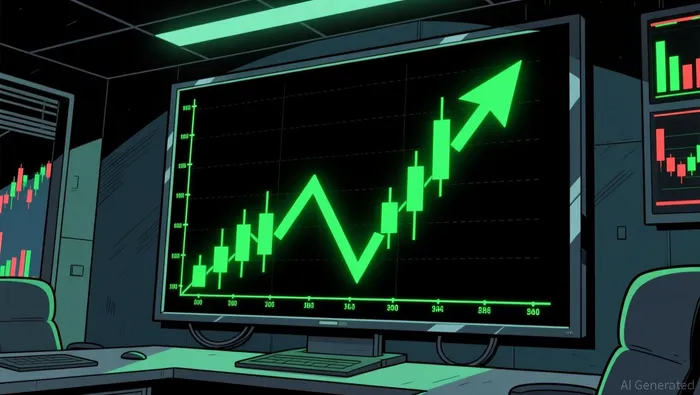
Price action reveals distinct levels where market participants reacted strongly. The hourly chart shows a rejection at the 0.22501 high during the 12:00 UTC candle, where the price failed to sustain above this resistance. Conversely, the low of 0.16865 recorded at 04:00 UTC acted as a hard support floor, with the price bouncing immediately in the subsequent hours. The market structure indicates the price is currently closer to the resistance level of 0.22501 than the support at 0.16865. Candlestick analysis highlights a bearish engulfing pattern at 18:00 UTC on September 9, which contributed to the downward pressure. This was followed by a bullish engulfing pattern at 19:00 UTC, signaling a temporary shift in momentum. On September 10, a doji with a long lower shadow appeared at 06:00 UTC, suggesting indecision and a potential reversal point. The subsequent bullish engulfing pattern at 07:00 UTC confirmed buyer involvement. A doji appeared again at 08:00 UTC, indicating consolidation before the final push to the highs. The presence of long lower shadows at 03:00 and 06:00 UTC underscores the strength of buyers defending lower price levels.
Volume and Turnover vs. Historical Comparison
The 24-hour total volume for CNPYUSDT was approximately 16.9 million USDT. This is notably higher than the 15-day average daily volume of 12.9 million USDT, suggesting increased interest or churn. The 7-day average single-hour volume is approximately 538,428 USDT. Several hours exceeded twice this average threshold. The hour at 06:00 UTC on September 10 saw a volume of 1.3 million USDT, coinciding with a price drop to 0.17502. This high volume with no immediate follow-through in the same direction suggests a potential capitulation or stop-loss hunt. Another significant spike occurred at 09:00 UTC with 1.79 million USDT volume, driving the price up to 0.20507. The hour at 10:00 UTC recorded 1.97 million USDT, pushing the price further to 0.20755. The final hour at 12:00 UTC had 1.16 million USDT volume, closing near the highs at 0.22461. The volume anomalies appear to have driven price effectively, particularly the reversal from the 04:00-06:00 UTC lows. The high volume at the bottom suggests absorption of sell orders, while the volume at the top suggests strong buying interest. However, the lack of sustained volume at the very peak might indicate some profit-taking.
Look Back: Current Market Phase
The 15-day daily price range is 0.3, and the recent 3-day price change is approximately 15.71%. This significant prior move suggests the market is in a mean reversion phase. The price has moved sharply from lows near 0.16865 to highs near 0.22501 within 24 hours. This volatility is characteristic of a market correcting a previous trend or reacting to a specific event. The structure does not clearly show a sustained uptrend or downtrend over the 15-day period due to insufficient data for a definitive trend classification. However, the sharp reversal and subsequent consolidation suggest a balance between buyers and sellers. The market appears to be finding equilibrium after the recent volatility. Traders should be cautious as mean reversion phases can be unpredictable and prone to sharp reversals. The current phase suggests that the price could continue to fluctuate within the recent range unless a clear breakout occurs.
The market may continue to test the 0.22501 resistance level in the next 24 hours. A break above this level could signal further upside towards 0.23000. Conversely, a failure to hold above 0.20000 could lead to a retest of the 0.17500 support level.

Decoding market patterns and unlocking profitable trading strategies in the crypto space
Latest Articles
Stay ahead of the market.
Get curated U.S. market news, insights and key dates delivered to your inbox.


AInvest
PRO
AInvest
PRO




Comments
No comments yet