
CNC Gaps Up and Retakes the 50-Day— Now $69.35 Decides Whether This Year's 117% Rally Enters Price Discovery or Springs a Trap
 Aime Summary
Centene (NYSE: CNC) is up nearly 5% in the first hour of trading Thursday, gapping from yesterday's $64.06 close to a $65.50 open and running to $68.20 before settling near $67.19. Ten minutes ago this was a broken pullback; right now it is a test of the highest price this stock has traded in a year.

The line that matters is $69.35 — the 52-week high. Everything else is noise until price resolves there.
The chart just did something that changes the odds
Centene has roughly doubled over the past year, but the move was never smooth. The stock tagged a 52-week high near $69.35, then got sold hard — dipping to $61.81 intraday yesterday before closing at $64.06. That was a real rejection, an ~8% round trip off the top.
Today's gap erases most of that damage in a single open. The key structural event is that price has reclaimed its 50-day moving average (near $65.57), and not in a crawl — in a 4.9% thrust that exceeds the stock's own daily ATR of about $2.36. In other words, this is a displacement above the trend-line the pullback broke, delivered in one charge.
This is what a technical contest looks like: a year-long uptrend that handed sellers a clean flush near $69, then snapped back so hard it re-took the trend line in a single gap. The buyers who chased on the way up to $69 and got dragged down to $61.80 are now watching price climb back toward their entry. Their fate — and the fate of everyone who re-bought today's gap — is decided by one number.
Why this rally has a real engine, not just momentum
The reason participation can persist here is that the doubling is built on an actual earnings inflection, not a retail meme. CenteneCNC-- entered 2026 guiding to adjusted earnings per share above $3.00 after a brutal 2025 that produced a GAAP loss. By the July quarter it had raised that 2026 adjusted EPS target to more than $4.80, lifted GAAP guidance above $3.11, and reported a sharp year-over-year improvement in commercial margins. Revenue guidance was raised too, to roughly $193.5–$197.5 billion.
For context: at $67 a share against that raised 2026 adjusted EPS floor, the stock trades in the low-to-mid teens on a forward adjusted basis — not an expensive multiple for someone who just watched the company more than double its guided earnings in six months. That is the backdrop that can make a breakout stick. It is the "why" behind a chart that might otherwise look overheated.
The decision level and what each side means
Everything runs through $69.35. Here is the binary.
Break $69.35 (ideally a daily close above it): the stock clears the highest print of the past year and steps into price discovery — there is no significant overhead supply on the chart above an annual high, which is what makes a fresh 52-week-high breakout qualitatively different from a move into a well-defended zone. The recent high near $68.20 and the round-number drift to $69 are just waypoints; once sellers at the old high are cleared, the next question is what the money-flow re-rating can carry.
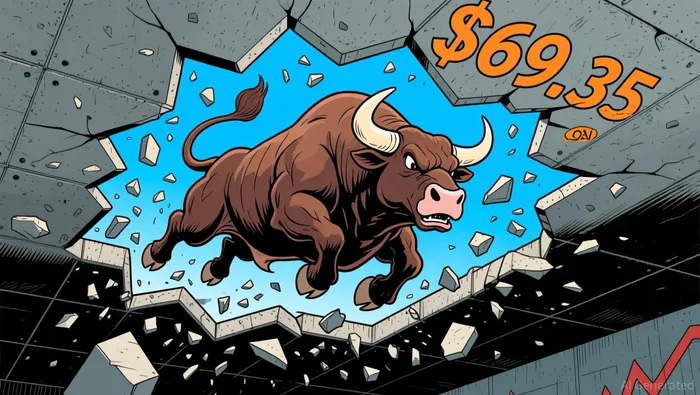
Reject at $69.35 and lose the gap: the re-buyers who entered today's gap near $65.50 become trapped. A second failure at the same ceiling turns the pattern from "pullback and reclaim" into a double top, and the air below is real — the next tested shelf is the $61.80–$64.00 base that just held, then the 50-day is gone. That is a setup where the same level that rewarded the patient punishes the late.
The map
| Scenario | Trigger | Path | Invalidation | Horizon |
|---|---|---|---|---|
| Breakout | Daily close above $69.35 | Price discovery; prior high $68.20 is just a way-station | Close back below $65.50 (today's gap) | Days to weeks |
| Reclaim holds | Holds above $65.50, then retests $69 | Churn between $65.50 and $69 before resolving | Lose $65.50 / the 50-day at $65.57 | Days |
| Failed retest | Reject at $69, close below $65.50 | Double top; re-test $61.80–$64.00 | None — thesis is off, not defended | Days |
Two honest caveats. First, the gap is still open: price has not confirmed the breakout yet, so the reward on the far side of $69.35 is being offered at the cost of buying mid-range, inside a day that already moved more than its average range. Second, the early flow is mixed, not one-way — the block tape was net negative early even as large orders leaned positive, so participation is building rather than uniform. That is normal for the first hour of a reclaim day.
The verdict
Centene has done the hard part — it took back the trend line and put itself within a hair of the price that would open a genuinely empty chart. But a reclaim is only the setup, and the setup has exactly two endings. Hold above $65.50 and push a confirmed close over $69.35, and the need-to-cover and the fresh-money bid have room to run into price discovery. Reject at $69.35 and fall back through the gap, and the people who just re-entered become the trapped inventory that fuels the next leg down.
The number, the message, the whole contest: $69.35, or nothing.
Data as of ~10:10 a.m. ET, September 10, 2026. Prices are intraday, not adjusted for after-hours prints. This is a technical and structural read, not personal investment advice.

Stay ahead of the market.
Get curated U.S. market news, insights and key dates delivered to your inbox.


AInvest
PRO
AInvest
PRO




Comments
No comments yet