
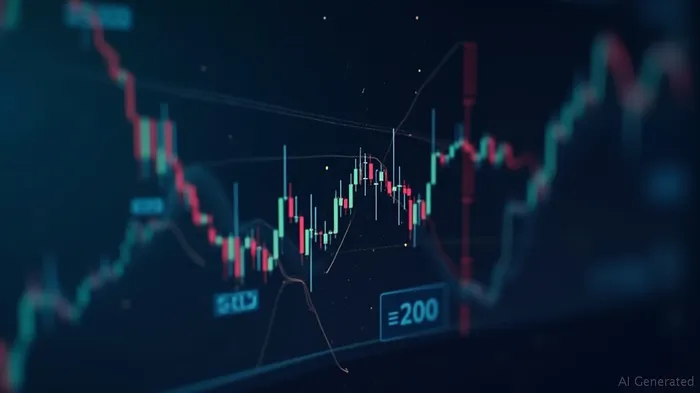
Cn Energy's 15min Chart Shows KDJ Death Cross, Bearish Marubozu Pattern
ByAinvest
Thursday, May 29, 2025 3:47 pm ET2min read
CNEY--
The KDJ Death Cross, which occurs when the K line (fast stochastic) crosses below the D line (slow stochastic), typically indicates a bearish momentum shift. This signal often precedes a decline in price as short-term traders interpret it as overbought conditions reversing [1]. The Bearish Marubozu indicator further supports this bearish trend, indicating a strong selling pressure and a potential continuation of the downtrend.
The CN Energy Group Inc. stock price gained 1.45% on the last trading day (Thursday, 29th May 2025), rising from $2.75 to $2.79. However, the stock has fallen in 6 of the last 10 days but is still up by 1605.38% over the past 2 weeks. The volume has increased on the last day along with the price, which is a positive technical sign. The stock lies in the upper part of a very wide and strong rising trend in the short term, but the activation of bearish indicators suggests a potential sell opportunity for short-term traders [2].
The CN Energy Group Inc. stock holds a sell signal from the short-term Moving Average; however, there is a buy signal from the long-term average. This suggests a general buy signal in the stock, giving a positive forecast for the stock. On further gains, the stock will meet resistance from the short-term Moving Average at approximately $2.79. On a fall, the stock will find some support from the long-term average at approximately $0.754 [2].
The stock is overbought on RSI14 and lies in the upper part of the trend, which may pose a good selling opportunity for the short-term trader. However, the high RSI together with the trend position increases the risk, and higher daily movements (volatility) should be expected. A correction down in the nearby future seems very likely and it is of great importance that the stock manages to break the trend before that occurs [2].
For the upcoming trading day on Friday, 30th, we expect CN Energy Group Inc. to open at $2.83, and during the day (based on 14 day Average True Range), to move between $2.53 and $3.05, which gives a possible trading interval of +/-$0.261 (+/-9.37%) up or down from last closing price. If CN Energy Group Inc. takes out the full calculated possible swing range there will be an estimated 18.74% move between the lowest and the highest trading price during the day [2].
References:
[1] https://www.ainvest.com/news/defi-development-19-plunge-technical-sell-sector-shift-2505/
[2] https://stockinvest.us/stock/CNEY
Based on the technical analysis of Cn Energy's 15-minute chart, the KDJ Death Cross and Bearish Marubozu indicators were triggered on May 29, 2025 at 15:45. This suggests that the momentum of the stock price is shifting towards the downside and has the potential to further decrease. Sellers are currently in control of the market, and it is likely that the bearish momentum will continue.
On May 29, 2025, at 15:45, the technical analysis of CN Energy Group Inc. (CNEY) triggered significant bearish indicators on its 15-minute chart. The KDJ Death Cross and Bearish Marubozu indicators were activated, signaling a potential shift in the stock's momentum towards the downside. This suggests that sellers are currently in control of the market, and the bearish momentum is likely to continue.The KDJ Death Cross, which occurs when the K line (fast stochastic) crosses below the D line (slow stochastic), typically indicates a bearish momentum shift. This signal often precedes a decline in price as short-term traders interpret it as overbought conditions reversing [1]. The Bearish Marubozu indicator further supports this bearish trend, indicating a strong selling pressure and a potential continuation of the downtrend.
The CN Energy Group Inc. stock price gained 1.45% on the last trading day (Thursday, 29th May 2025), rising from $2.75 to $2.79. However, the stock has fallen in 6 of the last 10 days but is still up by 1605.38% over the past 2 weeks. The volume has increased on the last day along with the price, which is a positive technical sign. The stock lies in the upper part of a very wide and strong rising trend in the short term, but the activation of bearish indicators suggests a potential sell opportunity for short-term traders [2].
The CN Energy Group Inc. stock holds a sell signal from the short-term Moving Average; however, there is a buy signal from the long-term average. This suggests a general buy signal in the stock, giving a positive forecast for the stock. On further gains, the stock will meet resistance from the short-term Moving Average at approximately $2.79. On a fall, the stock will find some support from the long-term average at approximately $0.754 [2].
The stock is overbought on RSI14 and lies in the upper part of the trend, which may pose a good selling opportunity for the short-term trader. However, the high RSI together with the trend position increases the risk, and higher daily movements (volatility) should be expected. A correction down in the nearby future seems very likely and it is of great importance that the stock manages to break the trend before that occurs [2].
For the upcoming trading day on Friday, 30th, we expect CN Energy Group Inc. to open at $2.83, and during the day (based on 14 day Average True Range), to move between $2.53 and $3.05, which gives a possible trading interval of +/-$0.261 (+/-9.37%) up or down from last closing price. If CN Energy Group Inc. takes out the full calculated possible swing range there will be an estimated 18.74% move between the lowest and the highest trading price during the day [2].
References:
[1] https://www.ainvest.com/news/defi-development-19-plunge-technical-sell-sector-shift-2505/
[2] https://stockinvest.us/stock/CNEY
Stay ahead of the market.
Get curated U.S. market news, insights and key dates delivered to your inbox.
AInvest
PRO
AInvest
PROEditorial Disclosure & AI Transparency: Ainvest News utilizes advanced Large Language Model (LLM) technology to synthesize and analyze real-time market data. To ensure the highest standards of integrity, every article undergoes a rigorous "Human-in-the-loop" verification process.
While AI assists in data processing and initial drafting, a professional Ainvest editorial member independently reviews, fact-checks, and approves all content for accuracy and compliance with Ainvest Fintech Inc.’s editorial standards. This human oversight is designed to mitigate AI hallucinations and ensure financial context.
Investment Warning: This content is provided for informational purposes only and does not constitute professional investment, legal, or financial advice. Markets involve inherent risks. Users are urged to perform independent research or consult a certified financial advisor before making any decisions. Ainvest Fintech Inc. disclaims all liability for actions taken based on this information. Found an error?Report an Issue

ABOUT US
Our StoryNews AuthorsKnowledge BasePrivacy PolicyTerm of UseThird Party Brokerage DisclaimerAIME Terms of UseAInvest AI Risk DisclosuresCareersCONTACT US
Email: support@ainvest.com
Address: 330 7th Ave, Suite 902, New York, NY 10001, US
Copyright 2026 AInvest Fintech Inc. All rights reserved.
Comments
No comments yet