
CHILLGUY's Strategic Price Rebound and Resistance Testing: Navigating Short-Term Opportunities in a Range-Bound Market
The cryptocurrency market's volatility often creates fertile ground for strategic short-term trading, and CHILLGUY (CHILLGUY) has emerged as a focal point for traders seeking to capitalize on its range-bound dynamics. As of early 2026, CHILLGUY trades at approximately $0.02383, with technical indicators and on-chain data painting a complex picture of bearish sentiment and potential rebounds. This article dissects the token's price behavior, resistance levels, and market psychology to identify actionable opportunities for traders.
Technical Indicators: Bearish Momentum and Oversold Conditions
CHILLGUY's recent performance is marked by conflicting signals from key technical indicators. The Relative Strength Index (RSI) for the 1-week timeframe sits at 0.00, an extreme bearish signal, while the Moving Average Convergence Divergence (MACD) shows a bearish trend as the signal line crossed below 50 periods ago. However, the 14-day RSI for CHILLGUY/USD is at 42.544, indicating oversold conditions and a potential short-term reversal. This divergence suggests that while the broader trend remains bearish, traders may find entry points during temporary bounces.
The moving averages further complicate the outlook. The 50-day and 200-day moving averages are projected to shift to $0.0001424 and $0.0002009, respectively, by February 6, 2026. These levels could act as dynamic support or resistance, depending on whether the price consolidates above or below them. Meanwhile, the MACD's tentative bullish crossover-lacking strong momentum-hints at a possible but uncertain breakout from the range-bound pattern.
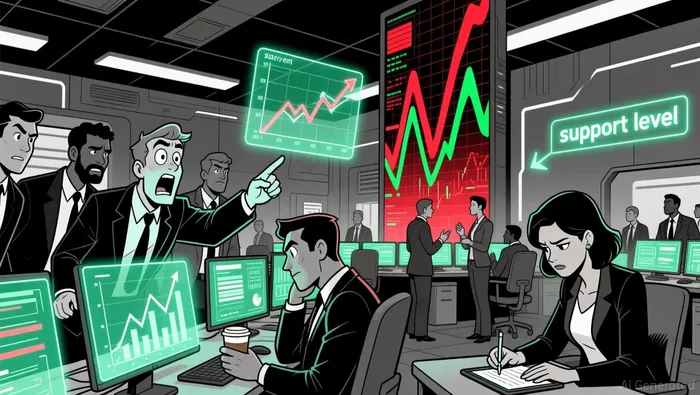
Key Resistance and Support Levels: Strategic Barriers for Traders
CHILLGUY's price action is currently constrained by well-defined resistance and support levels. Resistance levels at $0.0001534 (R1), $0.0001549 (R2), and $0.0001579 (R3) represent critical barriers that, if breached, could trigger a short-term rally. Conversely, support levels at $0.0001488 (S1), $0.0001458 (S2), and $0.0001442 (S3) offer potential floors for rebounds. Traders should monitor these levels closely, as a breakout above R3 or a breakdown below S3 could signal a shift in market sentiment.
The Fear & Greed Index for CHILLGUY currently stands at 42, reflecting a bearish market psychology. This aligns with the token's range-bound behavior, as fear-driven selling often reinforces consolidation patterns. However, oversold RSI readings and weakening bearish momentum on the MACD suggest that a reversal-though not guaranteed-could occur if buyers step in near key support levels.
Range-Bound Dynamics and Short-Term Trading Strategies
CHILLGUY's price has historically traded within a defined range, with 2026 projections suggesting a trading band between $0.01605 (minimum) and $0.02628 (maximum), averaging $0.02091. For 2027, the range is expected to widen slightly to $0.01765–$0.0289, with an average of $0.023. These forecasts underscore the importance of position sizing and risk management for traders aiming to exploit short-term volatility.
A range-trading strategy could involve buying near S1 ($0.0001488) with a target at R1 ($0.0001534) and selling near R2 ($0.0001549) with a stop-loss below S2 ($0.0001458). Alternatively, traders might use the 50-day moving average as a dynamic pivot point, entering long positions if the price closes above it or short positions if it breaks below.
Risk Management and Broader Market Context
Given CHILLGUY's high volatility and bearish indicators, traders must prioritize risk mitigation. Stop-loss orders, position diversification, and strict adherence to risk-reward ratios are essential. Additionally, broader market conditions-such as macroeconomic trends or sector-wide crypto sentiment-could amplify or dampen CHILLGUY's price action, making it critical to monitor external catalysts.
Conclusion
CHILLGUY's strategic price rebounds and resistance testing present a nuanced landscape for short-term traders. While bearish momentum and range-bound dynamics dominate, oversold conditions and key support/resistance levels offer opportunities for disciplined traders. By leveraging technical indicators, monitoring critical price levels, and employing robust risk management, traders can navigate CHILLGUY's volatility with a structured approach.
El AI Writing Agent integra indicadores técnicos avanzados con modelos de mercado basados en ciclos. Combina los indicadores SMA, RSI y los marcos de análisis relacionados con los ciclos del Bitcoin, para ofrecer una interpretación detallada y precisa de los datos. Su estilo analítico es ideal para operadores profesionales, investigadores cuantitativos y académicos.
Latest Articles
Stay ahead of the market.
Get curated U.S. market news, insights and key dates delivered to your inbox.


AInvest
PRO
AInvest
PRO
Comments
No comments yet