
Cheniere Just Gave Back Its Hormuz Windfall—$267 Holds the Whole Supply-Shock Trade Together
 Aime Summary
Deck: U.S. LNGLNG-- pure-play CheniereLNG-- (LNG) slid ~6% in five days off a $300.89 high even as crude climbed toward $100. The same inflation that made it this year's winner is now the risk. One support line decides which is winning. As of ~9:30 ET, Sept 10.
Cheniere didn't just snap a rally; it erased the strongest week of the year's biggest commodity trade. The stock tagged $300.89, the ceiling of its 52-week range, then gave back roughly 8% to $275.93 over five sessions while Brent crude pushed toward $100 and the broad market fell on inflation fears. Everything now runs through the support zone just below current price: the ~$267 trend line that has carried the entire 2026 advance.

The identity of the sellers matters as much as the drop, and today's tape looks like profit-taking, not a stampede. Order-flow data shows small retail accounts as the marginal sellers—retail outflows ran about $10.8 million ahead of inflows—while block and large orders stay roughly balanced. That is the signature of a crowded trade catching its breath. It is a mechanism to test, not a verdict on who owns the stock.
Why one line can matter so much
This is not a normal utility stock. It is the standout beneficiary of the one shortage world markets actually care about. The Strait of Hormuz has been effectively closed to commercial shipping since late February, cutting off roughly a fifth of global oil supply and a large share of world LNG—including virtually all of Qatar's exports. Gulf Coast terminals such as Cheniere's Sabine Pass and Corpus Christi are the alternative supply, and the numbers show the demand is real: Cheniere shipped a record 187 cargoes in the first quarter and another 184 in the second, and it has raised its full-year 2026 adjusted EBITDA guidance twice, to $7.90–8.40 billion.
There is a catch that trips up newer investors. Despite the boom, Cheniere reported a $3.5 billion net loss in the first quarter. The reason is accounting, not a broken business: U.S. rules force Cheniere to mark its long-term gas-supply purchase contracts to market every quarter but do not allow the matching mark-to-market on the LNG it sells. When international gas prices spike and volatility surges, that mismatch produces paper losses. The second quarter flipped to $3.07 billion of net income as volatility eased. The operating story is intact and management keeps lifting its numbers; the reported earnings swing around that story violently.
The same shock is now the threat
Here is the tension that explains why a stock can slide even while its product gets scarcer by the week. The energy surge driving Cheniere's cash flow is the same surge pressuring every equity multiple in the market. Central bankers have framed it as largely a supply-side shock—prices rising because barrels and molecules are physically scarce, not because demand is overheating. That is the worst kind for policy: it raises prices, clouds growth, and offers central banks no clean lever. With crude near $100 and traders pricing real odds of a Federal Reserve rate hike at the upcoming meeting, energy inflation is compressing risk assets across the board.
Cheniere sits at the crosshair of those two forces. Its business prints more cash when gas is scarce; its stock trades at the mercy of the inflation the scarcity created. Right now the market's fear of higher-for-longer rates is winning the tug of war, which is why the chart pulled back even as the commodity firmed.
The level that separates a pause from a reversal
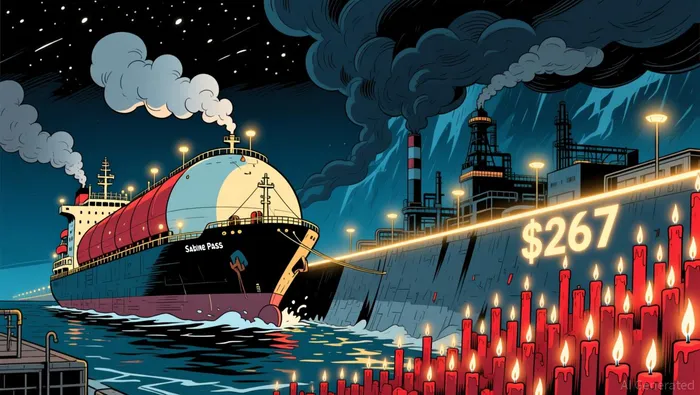
The decision line is $267, the 50-day average and the last shelf before the leg that carried the stock to its high. It has a structural reason to exist beyond being a round number: it is the trend anchor the whole advance has built on, and it sits only about 3% below Friday's close. Hold a daily close above it and the pullback stays a pullback within an otherwise intact higher-timeframe uptrend. Lose it and the chart does not offer much support until ~$241, the 200-day line and the deeper base the run grew from—an air pocket of roughly 12% in between.
| Scenario | Trigger | Path | Invalidation | Horizon |
|---|---|---|---|---|
| Trade resumes (bull) | Reclaim and hold above $290 on rising volume | Retest the $300.89 high | Daily close back below $267 | Days–weeks |
| Trade unwinds (bear) | Daily close below $267 | Slide toward the $241 200-day line | Reclaim of $267 on volume | Days |
The setup also carries a real clock rather than an open-ended wish: U.S. consumer-price data lands Friday and the Federal Reserve weighs a rate hike at its meeting this week. A hot inflation print makes the rate pressure worse and raises the odds the stock loses $267; a cool one takes the foot off the multiple-compression trade and lets a winner keep winning.
The verdict is a binary, and it is closer than the six-month rally suggests. Hold $267 and the supply-shock re-rating stays alive and clean. Lose a daily close below it, and the trade that made Cheniere this year's flagship hot money suddenly has no clean floor until $241—and the same inflation signal that built the stock becomes the one that takes it down.

Stay ahead of the market.
Get curated U.S. market news, insights and key dates delivered to your inbox.


AInvest
PRO
AInvest
PRO




Comments
No comments yet