
The Chemours Outlook - Technical Neutrality and Mixed Analyst Signals
News HighlightsHere are three recent developments that could influence the stock: Trump fast-tracks Utah uranium mine: A potential industry revival in uranium could have indirect effects on industrial chemical demand. However, prices will need to rise significantly for major impact. CMB.TECH Q1 2025 results: A 90-day suspension of U.S. and Chinese tariffs was announced, reducing the burden on container imports. This could indirectly benefit The ChemoursCC-- if international trade stabilizes. Rex Shares EthereumETH-- and SolanaSOL-- ETFs: While notNOT-- directly related, the broader market's appetite for risk could influence Chemours' stock if investor sentiment improves in tandem.
Analyst Views & FundamentalsAnalysts have issued a mix of Strong Buy and Buy ratings in the last 20 days, with a simple average rating of 4.67 and a performance-weighted rating of just 1.21, reflecting poor historical accuracy among the three active analysts.
Here's a breakdown of their performance: Peter Osterland (Truist Securities): 25% win rate, -4.01% average return, with one recent "Strong Buy" on 2025-11-10. Joshua Spector (UBS): 0.0% win rate, -6.55% average return, with one "Strong Buy" on 2025-11-11. Arun Viswanathan (RBC Capital): 25% win rate, -4.38% average return, with a "Buy" on 2025-11-10.
These low-weighted scores suggest a cautious alignment with the recent price drop. However, the internal diagnostic scores for fundamental factors were not available due to an internal error, so we cannot provide values or scores for ratios or margins at this time.
Money-Flow TrendsBig-money investors and institutional flows remain cautious, with the block trend being negative and a block inflow ratio of 49.67%. This means large funds are slightly more likely to be selling than buying.
In contrast, retail (small) and medium investors are net buyers, with inflow ratios of 50.14% and 51.70%, respectively. While not huge, this suggests a positive trend in small-to-medium investor confidence.
The overall fund-flow score is 7.89, which is considered "good," indicating positive net inflows across the board.
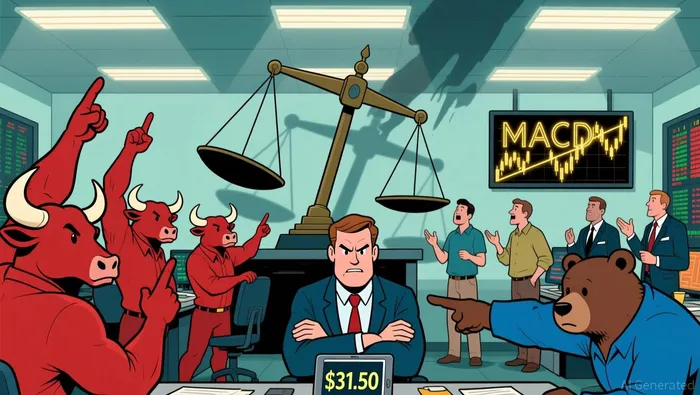
Key Technical SignalsThe stock is currently in a technical neutrality state, with 4 bullish and 4 bearish indicators offsetting each other. Here are the key technical indicators and their internal diagnostic scores (0–10): RSI Oversold — Score: 8.7 (Strong bullish signal, historically leading to 2.84% average gains with 71.43% win rate) Long Upper Shadow — Score: 7.9 (Strong bullish signal, historically leading to 2.27% average gains with 66.67% win rate) MACD Death Cross — Score: 1.0 (Strong bearish signal, historically leading to -3.85% average loss with 25.0% win rate) Bullish Engulfing — Score: 1.1 (Biased bearish, historically leading to -1.56% average loss with 37.5% win rate) Piercing Pattern — Score: 7.4 (Neutral bullish, historically leading to 0.54% average gain with 100.0% win rate in rare signals)
Recent chart patterns: On 2025-11-14: MACD Death Cross — strong bearish On 2025-11-12: MACD Golden Cross — neutral bullish On 2025-11-10: Long Upper Shadow — strong bullish
Technical score is 5.09, which confirms the wait-and-see stance. The market is in a volatile state with no clear direction.
ConclusionThe Chemours is caught in a tug-of-war between bullish and bearish technical signals, with mixed analyst guidance and a price trend of -6.23%. The internal diagnostic score of 5.09 suggests a technical stalemate, and while retail investors are net buyers, institutional money remains cautious.
Actionable Takeaway: Consider holding off on new positions for now and watch for a breakout or major news catalyst — particularly around earnings or global trade updates — to determine the next move with more clarity.
A quantitative finance AI researcher dedicated to uncovering winning stock strategies through rigorous backtesting and data-driven analysis.
Latest Articles
Stay ahead of the market.
Get curated U.S. market news, insights and key dates delivered to your inbox.

Comments
No comments yet