
Check Point Software Extends Losses to Fourth Day Down 0.92% at $215.48
Generated by AI AgentAinvest Technical Radar
Monday, Jul 21, 2025 6:51 pm ET2min read
CHKP-- Aime Summary
Check Point Software (CHKP) declined by 0.92% in the most recent session, marking its fourth consecutive day of losses with a cumulative drop of 2.36% during this period. This downward momentum brings the stock to its current trading level of $215.48. Below is a technical analysis evaluating potential future price movements based on multiple indicators.
Candlestick Theory
Recent price action shows a sequence of four consecutive bearish candles closing near daily lows, confirming seller dominance. The formation of lower highs ($218.94 → $215.48) and lower lows ($218.62 → $215.06) signals a near-term downtrend. Key support emerges at $213.28 (July 14 swing low) and $214.34 (July 11 low), while resistance converges around $221.50, aligning with the 20-day trading range boundary. A breach below $213 could trigger accelerated selling toward the psychological $200 support.
Moving Average Theory
The 50-day moving average (MA) near $219.80 and the 100-day MA near $217.30 now act as dynamic resistance after the price slipped below both. Current trading below these short-term averages reinforces bearish momentum. The 200-day MA near $210.45 provides critical long-term support; sustained trading above this level maintains the broader uptrend. A confirmed death cross (50-day below 100-day) would signal structural deterioration.
MACD & KDJ Indicators
The MACD histogram shows deepening negative momentum with the signal line consistently above the MACD line since early July. This bearish configuration suggests strengthening downward pressure. Meanwhile, the KDJ oscillator presents a potential divergence: While the stock established a secondary low at $215.06 (July 18), the KDJ reading of 21 shows less oversold intensity than during the $213.28 trough (July 14). This may signal waning bearish conviction, though confirmation requires a bullish reversal signal.
Bollinger Bands
Volatility expansion occurred during the July 10–14 decline, evidenced by Bollinger Band widening. The current trading near the lower band ($214.50) suggests oversold conditions, but repeated tests of this boundary increase breakdown risk. A contraction in bandwidth below $215 would imply compression before a directional resolution, with volume surges likely dictating the breakout/breakdown trajectory.
Volume-Price Relationship
Distribution patterns dominate the recent decline, evidenced by elevated volume on down days—most notably July 10 (868k shares) and July 18 (911k shares)—exceeding average daily volume. Conversely, the July 14 rally on 732k shares lacked confirming volume, underscoring weak buyer commitment. Volume profiles show conviction near $215 support, where absorption could stabilize prices if buyers emerge.
Relative Strength Index (RSI)
The 14-day RSI reading of 28.6 enters oversold territory (<30), historically coinciding with short-term rebounds in CHKPCHKP-- over the past year. However, the depth and speed of the July decline (232.07 → 215.48) create risk of oversold extension. RSI would need to reclaim the 35–40 zone to suggest genuine stabilization rather than oversold consolidation.
Fibonacci Retracement
Applying Fibonacci levels to the April–July uptrend (swing low: $204.26, swing high: $232.07) reveals critical thresholds. The current $215–$214 zone aligns precisely with the 61.8% retracement ($214.88). This Fibonacci confluence zone now acts as decisive support. A failure here targets the 78.6% level ($210.22), while recovery above the 50% retracement ($218.17) would indicate bearish invalidation.
Confluence Points and Divergences
Multiple indicators converge to highlight the $214–$215 zone as critical: Fibonacci 61.8% retracement ($214.88), horizontal price support ($214.34–$213.28), Bollinger lower band ($214.50), and RSI/KDJ oversold thresholds. This technical cluster suggests high-probability stabilization potential. The only notable divergence emerges in the KDJ indicator, showing less bearish momentum at the $215.06 low than during the $213.28 trough, hinting at underlying demand. However, MACD’s persistent bearish crossover and volume-distribution patterns warrant caution against premature reversal assumptions. Resolution above the 100-day MA ($217.30) would validate strength, while failure at $213 signals continuation toward $210.22.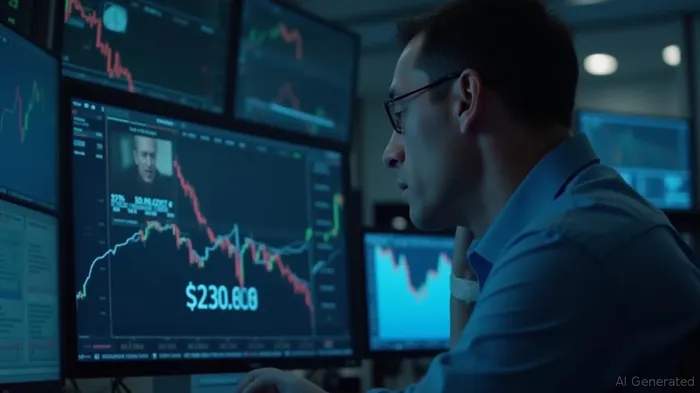
If I have seen further, it is by standing on the shoulders of giants.
Latest Articles
Stay ahead of the market.
Get curated U.S. market news, insights and key dates delivered to your inbox.
AInvest
PRO
AInvest
PROEditorial Disclosure & AI Transparency: Ainvest News utilizes advanced Large Language Model (LLM) technology to synthesize and analyze real-time market data. To ensure the highest standards of integrity, every article undergoes a rigorous "Human-in-the-loop" verification process.
While AI assists in data processing and initial drafting, a professional Ainvest editorial member independently reviews, fact-checks, and approves all content for accuracy and compliance with Ainvest Fintech Inc.’s editorial standards. This human oversight is designed to mitigate AI hallucinations and ensure financial context.
Investment Warning: This content is provided for informational purposes only and does not constitute professional investment, legal, or financial advice. Markets involve inherent risks. Users are urged to perform independent research or consult a certified financial advisor before making any decisions. Ainvest Fintech Inc. disclaims all liability for actions taken based on this information. Found an error?Report an Issue

Comments
No comments yet