
Must-See Charts| Is Wall Street Missing the Smart Money's Warning?
U.S. equities are hovering near all-time highs, buoyed by expectations of a September Fed rate cut and strong Q2 earnings. But behind the scenes, the so-called "smart money" is quietly making moves that suggest growing caution. Could the insiders be seeing something the market is missing?
After the July nonfarm payrolls came in below expectations, U.S. stocks corrected last week but quickly rebounded, returning to levels near their historical highs.
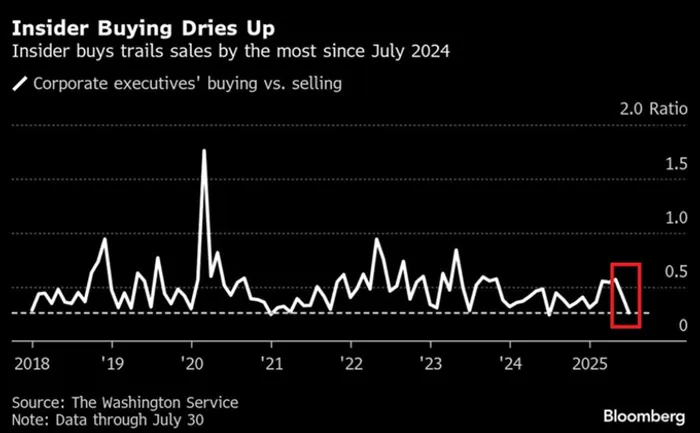
Interestingly, corporate executives—often dubbed the “smart money”—have taken this rally as an opportunity to cash out at an accelerating pace. The insider buy/sell ratio has plunged to 0.26, meaning that for every insider buyer, nearly four are selling. This is well below the long-term average of 0.45. A higher ratio typically suggests insiders are confident enough to buy back shares; a lower one implies they're exiting.
Only 151 companies in the S&P 500 saw insider buying last month, marking the lowest number since 2018.
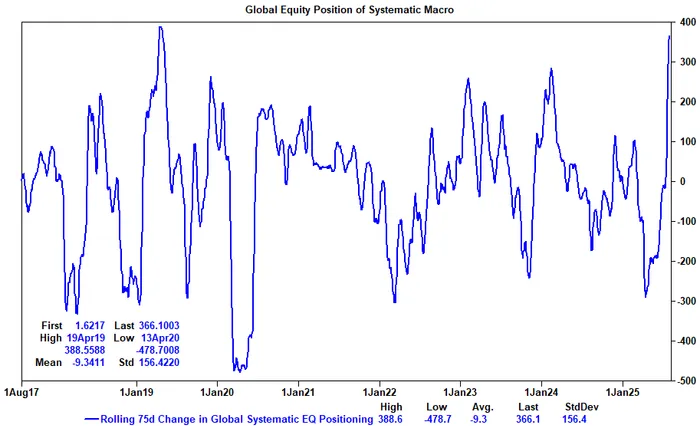
According to Goldman Sachs’ trading desk, quant funds have poured more than $365 billion into global equities over the past three months—reaching near full allocation. Are they now out of ammunition?
Next, let’s look at some charts on artificial intelligence:
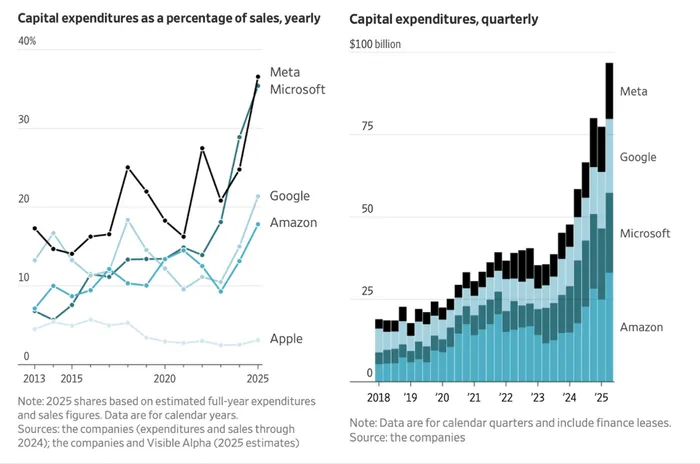
Six of the seven major tech giants—excluding Nvidia—have reported earnings, and AI remains the unavoidable theme. Google, MicrosoftMSFT--, AmazonAMZN--, and MetaMETA-- are expected to collectively spend nearly $400 billion in capital expenditures this year. Morgan StanleyMS-- projects that between 2025 and 2028, total AI infrastructure spending by big tech will reach a staggering $2.9 trillion. Even for cash-rich companies, this level of expenditure is unsustainable without outside capital.
Morgan Stanley estimates that to sustain such massive investments, big tech firms will need to raise around $1.5 trillion in external financing over the next three years.
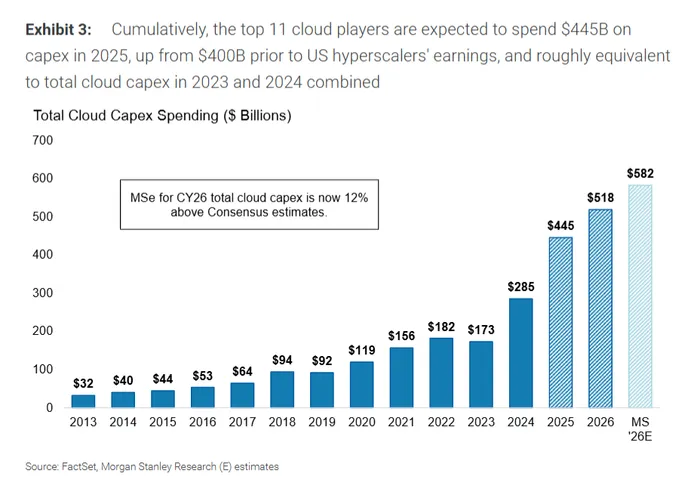
The world’s top 11 cloud service providers are now expected to spend $445 billion in capex this year—up 10% from the $400 billion estimate before earnings season. That’s roughly equivalent to the total capex for both 2023 and 2024.
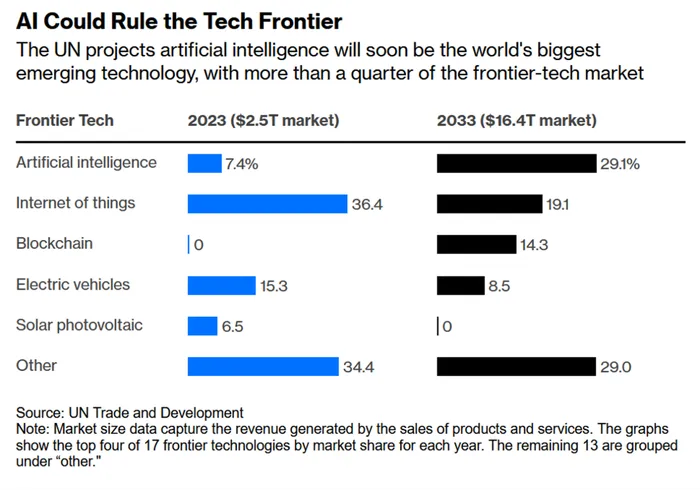
According to UNCTAD (United Nations Conference on Trade and Development), AI will become the world’s largest frontier technology by 2033. Its market size is forecast to grow from $185 billion in 2023 (7.4% of the frontier tech market) to $4.8 trillion by 2033, commanding a 29.1% share. This explosive growth will come at a cost: AI data centers are projected to consume up to 12% of the U.S.'s total electricity by 2028.
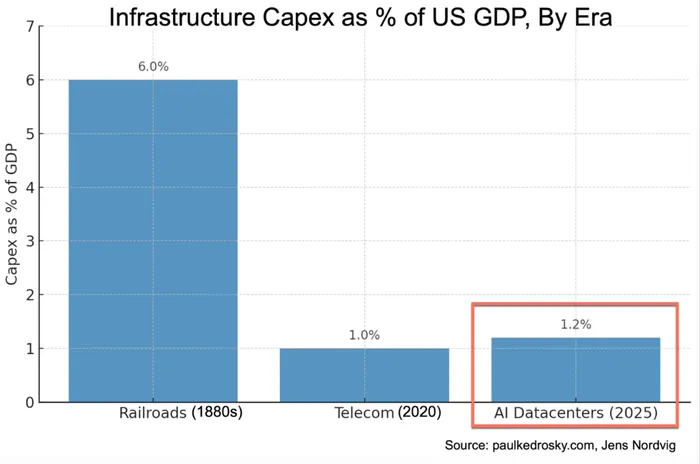
Economists Paul Kedrosky and Jens Nordvig estimate that AI data center capex in the U.S. now accounts for 1.2% of GDP—already exceeding the telecom infrastructure peak during the dot-com bubble (which was around 1%). Based on Nvidia’s revenue and related multipliers, annual AI infrastructure investment could boost U.S. GDP by 1.6% to 2.1%.
Historically, only the railway boom of the 1880s matched this scale of investment. But unlike railroads—built to last a century—AI infrastructure often becomes obsolete within 3 to 5 years.
There’s also an opportunity cost. Capital is finite. Massive AI infrastructure investment is crowding out other sectors.
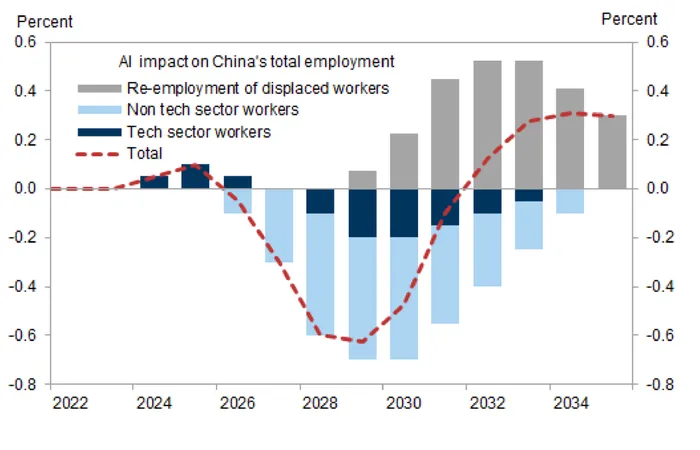
According to Goldman SachsGS-- models, the spread of AI will initially depress employment in China.
During the early phase, AI-driven hiring in tech slightly boosts employment. But starting in 2027, AI will likely cause a net negative impact on job markets, as labor displacement in non-tech industries outweighs gains in tech. The peak effect is expected around 2028–2029. From 2031 onward, job creation from new AI-related roles should absorb displaced workers, turning AI’s net employment impact positive.
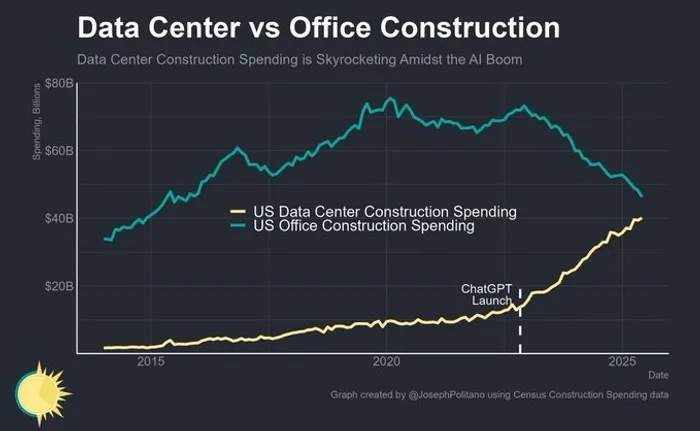
Data Centers vs Office Buildings:
Let’s turn to other intriguing chart insights.
In 2025, Chinese publicly listed companies (excluding financials) are expected to spend a record 3.6 trillion yuan on dividends and share buybacks—signaling a strategic shift from capex to shareholder returns.

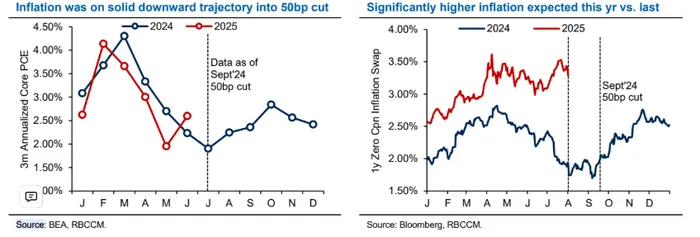
In July 2024, the Fed held rates steady, but some expect a 50-basis-point cut in September, hoping for a repeat of past easing cycles.
But things might be different this time. Last year, labor market conditions were worse (triggering the Sahm Rule recession signal) and inflation lower (core PCE at 1.9%, now hovering around 2.5%).
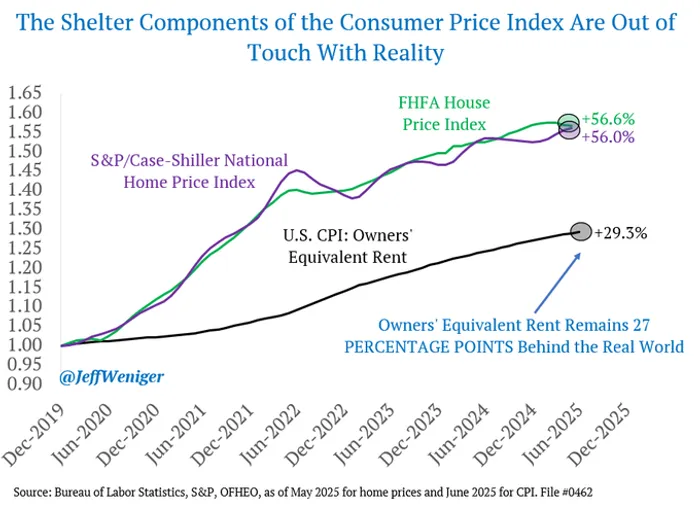
The U.S. Bureau of Labor Statistics (BLS) has come under fire for sharply revising down recent nonfarm payrolls, prompting wider skepticism. Remember, the BLS is also responsible for CPI inflation numbers, which some argue are just as unreliable.
Since 2020, U.S. home prices have surged over 50%, yet BLS estimates only reflect a 30% increase.
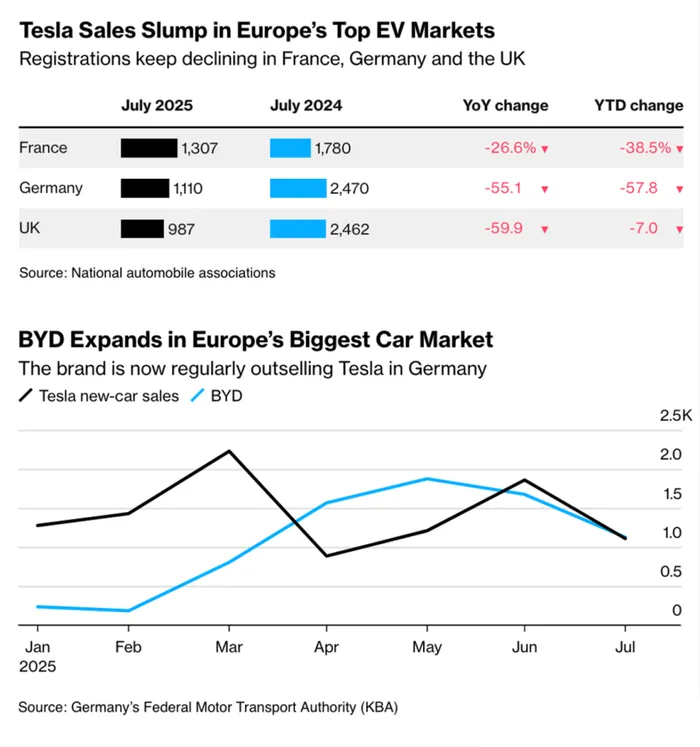
According to European auto associations, Tesla’s July sales in Germany and the U.K. plunged over 50% year-over-year, with a 26.6% drop in France.
BYD, Tesla’s main rival, has surpassed Tesla’s monthly sales in Germany three times this year and is close to matching its market share in the U.K.
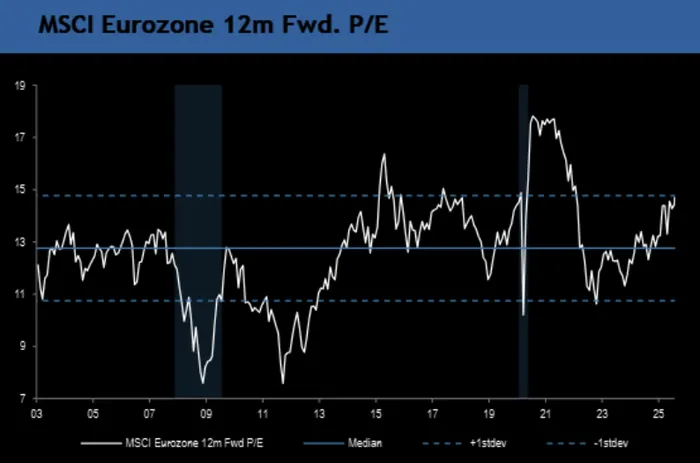
European stocks aren’t cheap either. The Eurozone benchmark index trades at a P/E ratio of around 15—more than one standard deviation above its 20-year average of just under 13.
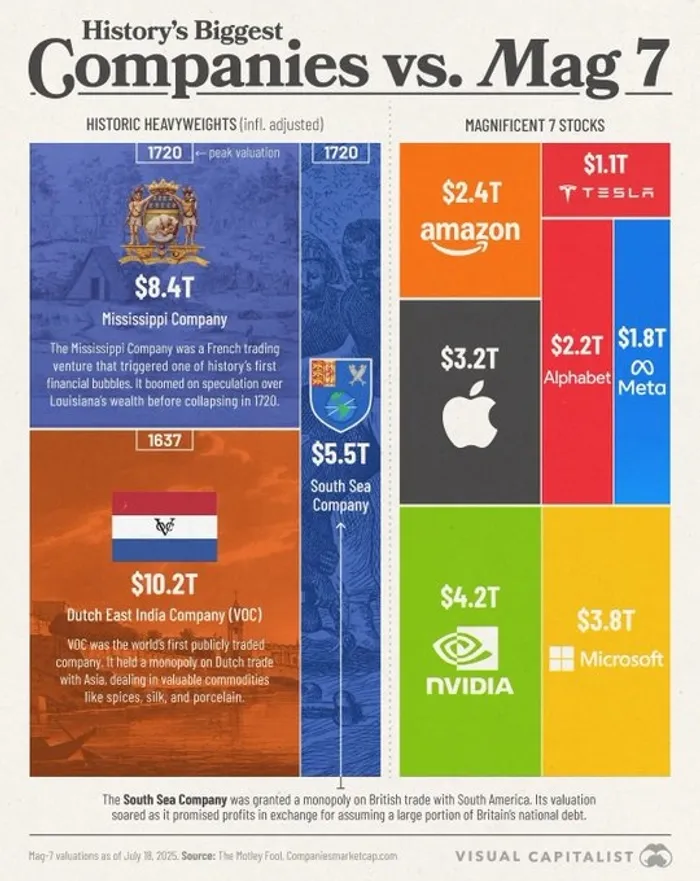
Nvidia may be the most valuable listed company today, but in the grand sweep of financial history, it only ranks fourth.
After adjusting for inflation, the most valuable company in history is the Dutch East India Company, with a valuation of $10.2 trillion in today’s dollars. The Mississippi Company and the South Sea Company also surpassed Nvidia’s adjusted value.After adjusting for inflation, the most valuable company in history is the Dutch East India Company, with a valuation of $10.2 trillion in today’s dollars. The Mississippi Company and the South Sea Company also surpassed Nvidia’s adjusted value.
Finally, BCA Research has challenged the long-held belief that higher economic growth leads to higher equity returns. Analyzing global equities from 2007 to 2024, they found that countries and sectors with strong GDP growth didn’t outperform. A major reason? Equity dilution.
Emerging economies like China and Vietnam often finance growth through new share issuance, which dilutes existing shareholders and pressures earnings per share (EPS) and long-term returns.

Independent investment research powered by a team of market strategists with 20+ years of Wall Street and global macro experience. We uncover high-conviction opportunities across equities, metals, and options through disciplined, data-driven analysis.
Latest Articles
Unlock Market-Moving Insights.
Subscribe to PRO Articles.
Already have an account? Sign in
Unlock Market-Moving Insights.
Subscribe to PRO Articles.
Already have an account? Sign in
Stay ahead of the market.
Get curated U.S. market news, insights and key dates delivered to your inbox.
