
Must-See Charts: U.S. Stocks Sink Near Highs—Buy or Bail?
Recently, U.S. stocks have retreated from historic highs. Is this a buying opportunity or a signal to exit? Let the charts provide the answer.
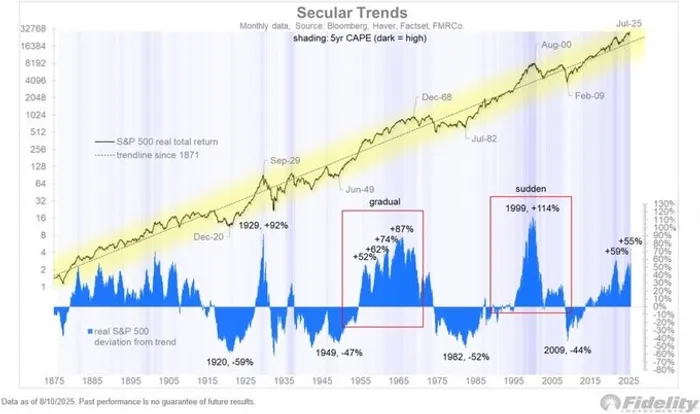
There are two historical parallels for the current market: the 1982–2000 tech bubble and the 1949–1968 “Nifty Fifty” era.
The tech bubble period saw an accelerating surge followed by a sharp crash, with the Nasdaq P/E ratio exceeding 100 times at the peak.
The “Nifty Fifty” era, by contrast, was characterized by a choppy, prolonged topping process.
Today’s market resembles the 1960s pattern more than the late-1990s frenzy. In the coming years, U.S. stocks may still deliver positive returns.
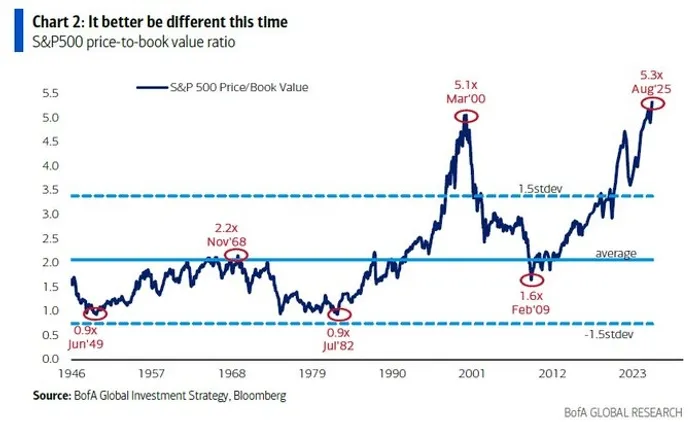
Still, valuations are undeniably high. The S&P 500’s price-to-book ratio has already surpassed the peak of the 2000 dot-com bubble.
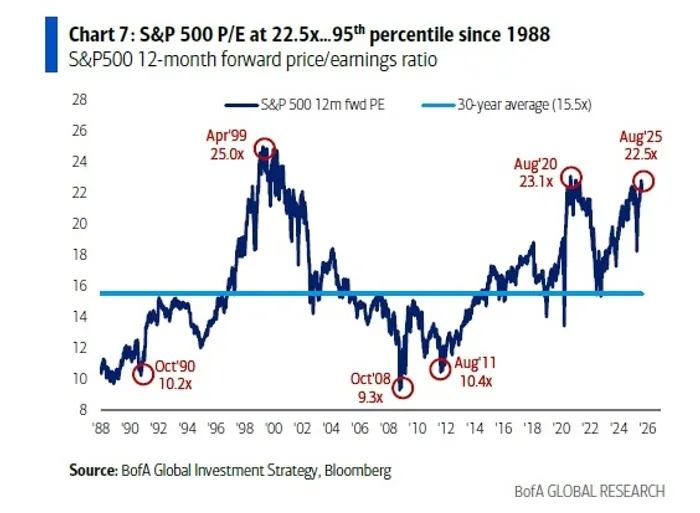
The P/E ratio is also at its third-highest level in nearly 30 years.
A key metric for long-term U.S. equity valuations—the cyclically adjusted earnings yield (CAPE earnings yield minus 10-year inflation expectations)—has recently fallen close to zero. Historically, this has occurred only at a few points: before the 1997 Asian financial crisis, at the 2000 dot-com peak, and at the 2021 market high.
_3ab7259d1755788959528.jpg?format=webp&width=700)
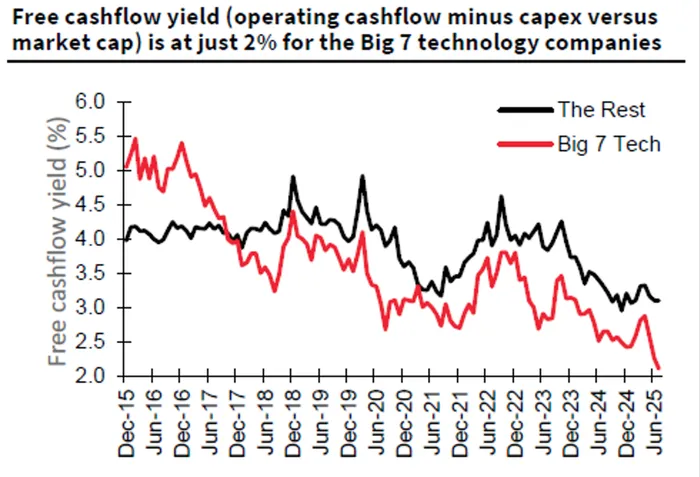
The “Magnificent Seven” have been the backbone of the bull market, but heavy AI-driven capital expenditures are eroding free cash flow. Their Capex-to-operating cash flow ratio has surged to nearly 45%, close to the market average.
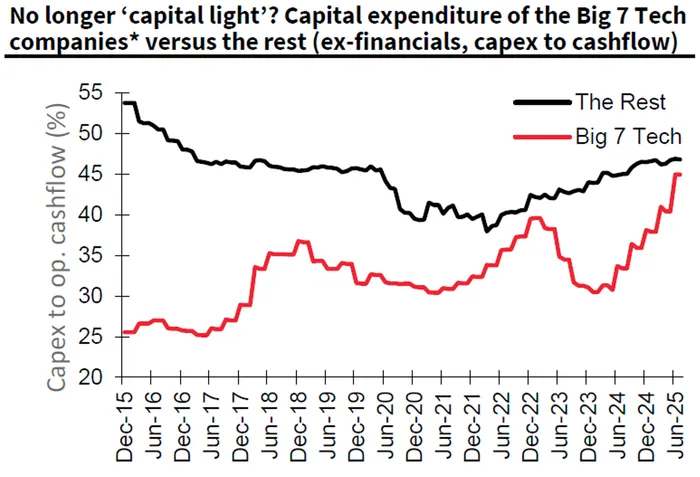
Their free cash flow yield has dropped to just 2%, well below the 3% level of other companies. This means less cash for buybacks, potentially weighing on future returns.
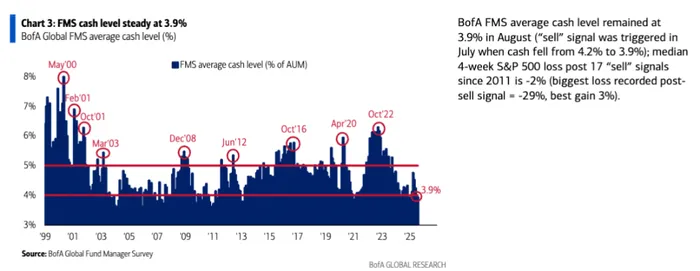
A Bank of AmericaBAC-- survey shows fund managers’ average cash holdings have dropped to 3.9%, suggesting most capital is already deployed. This triggered a BofA sell signal. By contrast, cash levels above 5% historically marked buying opportunities.
In sum, U.S. equity valuations are stretched, and investors should lower expectations rather than assume outsized returns will repeat.
Still, corporate earnings remain strong. If valuations retreat, it could create attractive entry points.
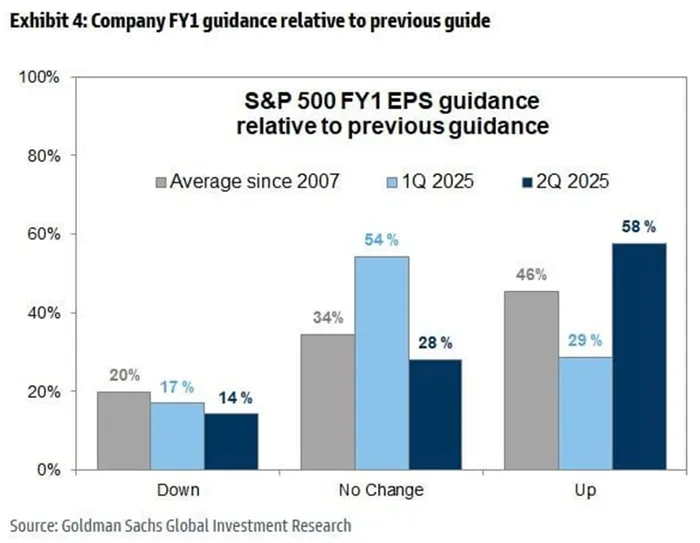
In Q2 2025 earnings season, 58% of S&P 500 companies raised full-year EPS guidance. This is double the Q1 level (29%) and well above the historical average (46% since 2007). Only 14% cut guidance, versus a 20% historical norm.
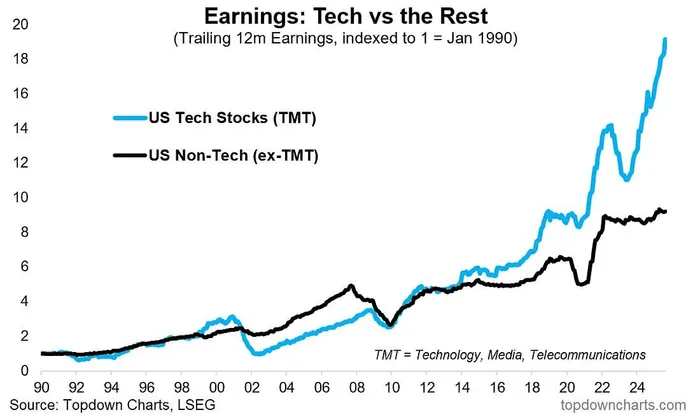
The EPS growth gap between U.S. tech and non-tech stocks continues to widen.
Next, let’s look at other charts.
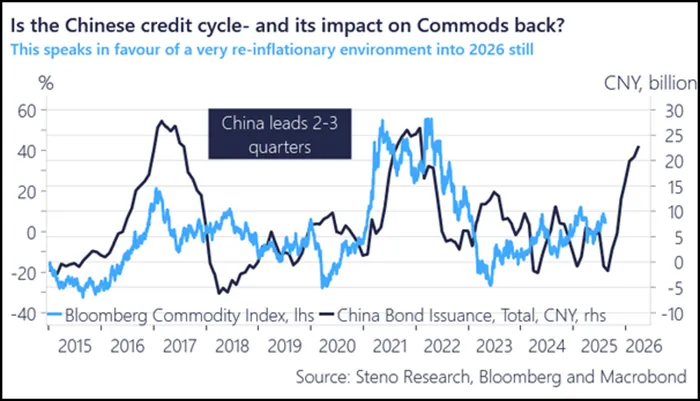
China’s total bond issuance rebounded sharply in 2025. Historically, such changes have led the global commodity index by 2–3 quarters. If history holds, this round of Chinese credit expansion could drive commodities into a new upcycle by early 2026.
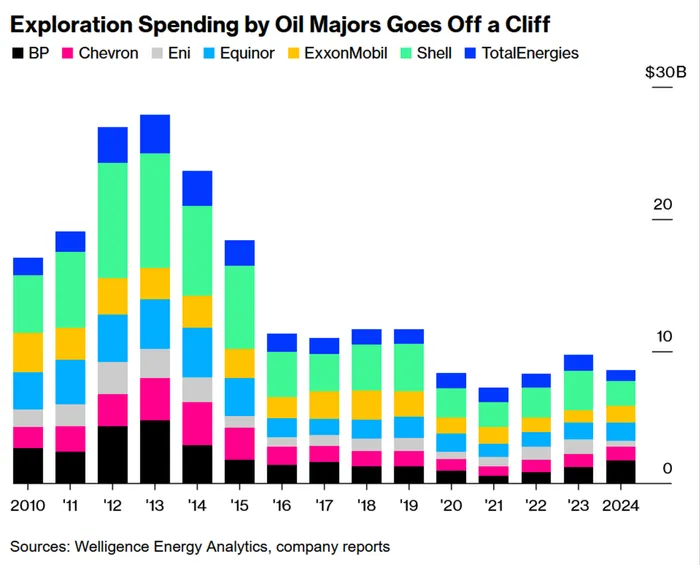
According to Welligence Energy Analytics, major oil companies’ exploration spending has plunged from a 2013 peak near $28 billion to about $8 billion in 2024. This lack of investment could cause supply shortages in coming years. Could oil prices see another rally?
How will companies deal with tariff costs? A U.S. Chamber of Commerce survey shows 93% of CEOs plan to improve technology to boost productivity and cut costs, followed by supplier negotiations. Yet 64% still plan to pass costs to customers.
_fe031d901755789486059.png?format=webp&width=700)
In 2024, stablecoin transaction settlement volume reached $28 trillion, exceeding the combined $23 trillion of VisaV-- ($13 trillion) and MastercardMA-- ($10 trillion).

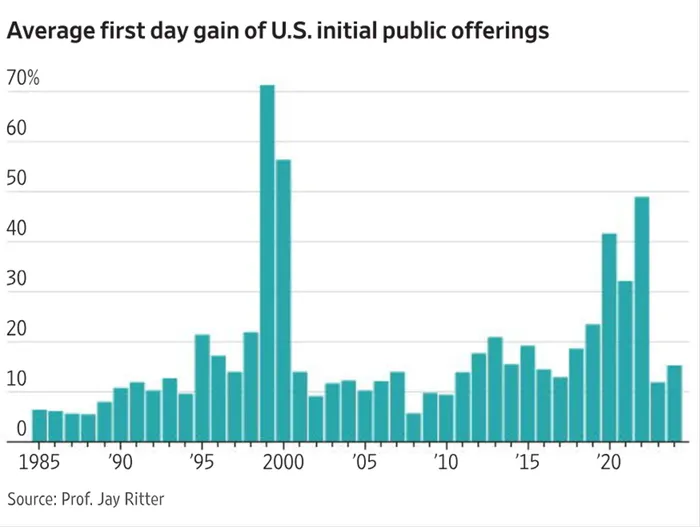
University of Florida finance professor Jay Ritter notes that today’s U.S. IPO market shows traits of past “irrational exuberance” eras, with “story stocks” in hot sectors like tech and crypto soaring on debut.
History shows the years with the biggest IPO first-day gains—1999–2000 and 2020–2021—coincided with market peaks. During those periods, many unprofitable firms went public and attracted frenzied investors, but long-term returns were poor. By contrast, some of the best long-term investments, such as AppleAAPL--, went public in the most subdued IPO years.
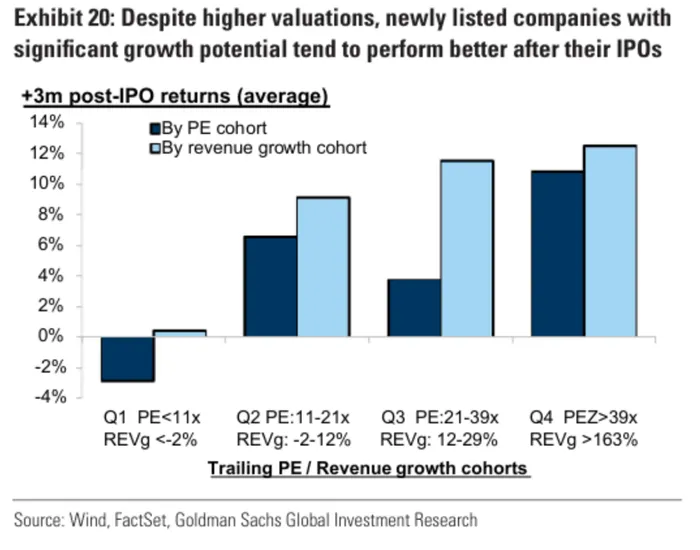
Goldman Sachs research finds growth potential is a stronger driver than valuations. Companies with the fastest revenue growth pre-IPO delivered average returns above 12% in the first three months, far outperforming those with weak or negative growth, whose post-IPO returns were negative.
Investors are willing to pay steep valuation premiums for growth. Thus, “growth stocks” priced at high P/Es often outperform cheap “value traps” lacking momentum.
Independent investment research powered by a team of market strategists with 20+ years of Wall Street and global macro experience. We uncover high-conviction opportunities across equities, metals, and options through disciplined, data-driven analysis.
Latest Articles
Unlock Market-Moving Insights.
Subscribe to PRO Articles.
Already have an account? Sign in
Unlock Market-Moving Insights.
Subscribe to PRO Articles.
Already have an account? Sign in
Stay ahead of the market.
Get curated U.S. market news, insights and key dates delivered to your inbox.


AInvest
PRO
AInvest
PRO