
Chart of the day 3-10: UPST

# UPSTUPST-- Technical & Gamma Exposure Analysis
## Current Price Action
- **Current Price**: $53.69 (-$1.79, -3.23%)
- **Range**: High $55.00 / Low $49.90
- **Volume**: 6.39M shares
## Technical Structure
UPST is currently in a significant technical retracement phase after declining sharply from its recent high of $96.43. The stock has formed a descending channelCHRO-- pattern, with multiple rejection points from the 200 and 250-day SMAs during previous rally attempts.
### Key Support Levels:
- **$52.86**: Critical support zone (multiple VWAP Session values align here)
- **$51.50**: Pre-market support level
- **$49.60**: Minor support with volume profile confirmation
- **$40.00**: Major historical support with high volume node
### Key Resistance Levels:
- **$55.00**: Immediate resistance (today's high)
- **$61.53-66.74**: Significant resistance cluster with multiple rejection points
- **$70.18-70.39**: Major resistance zone with prior consolidation
### Volume Profile Analysis
The volume profile indicates significant price acceptance at the $52.86 level, suggesting institutional activity. The negative P/E ratio (-36.699) is adding fundamental pressure, but the stock is approaching a value area on the volume profile where buyers previously showed interest.
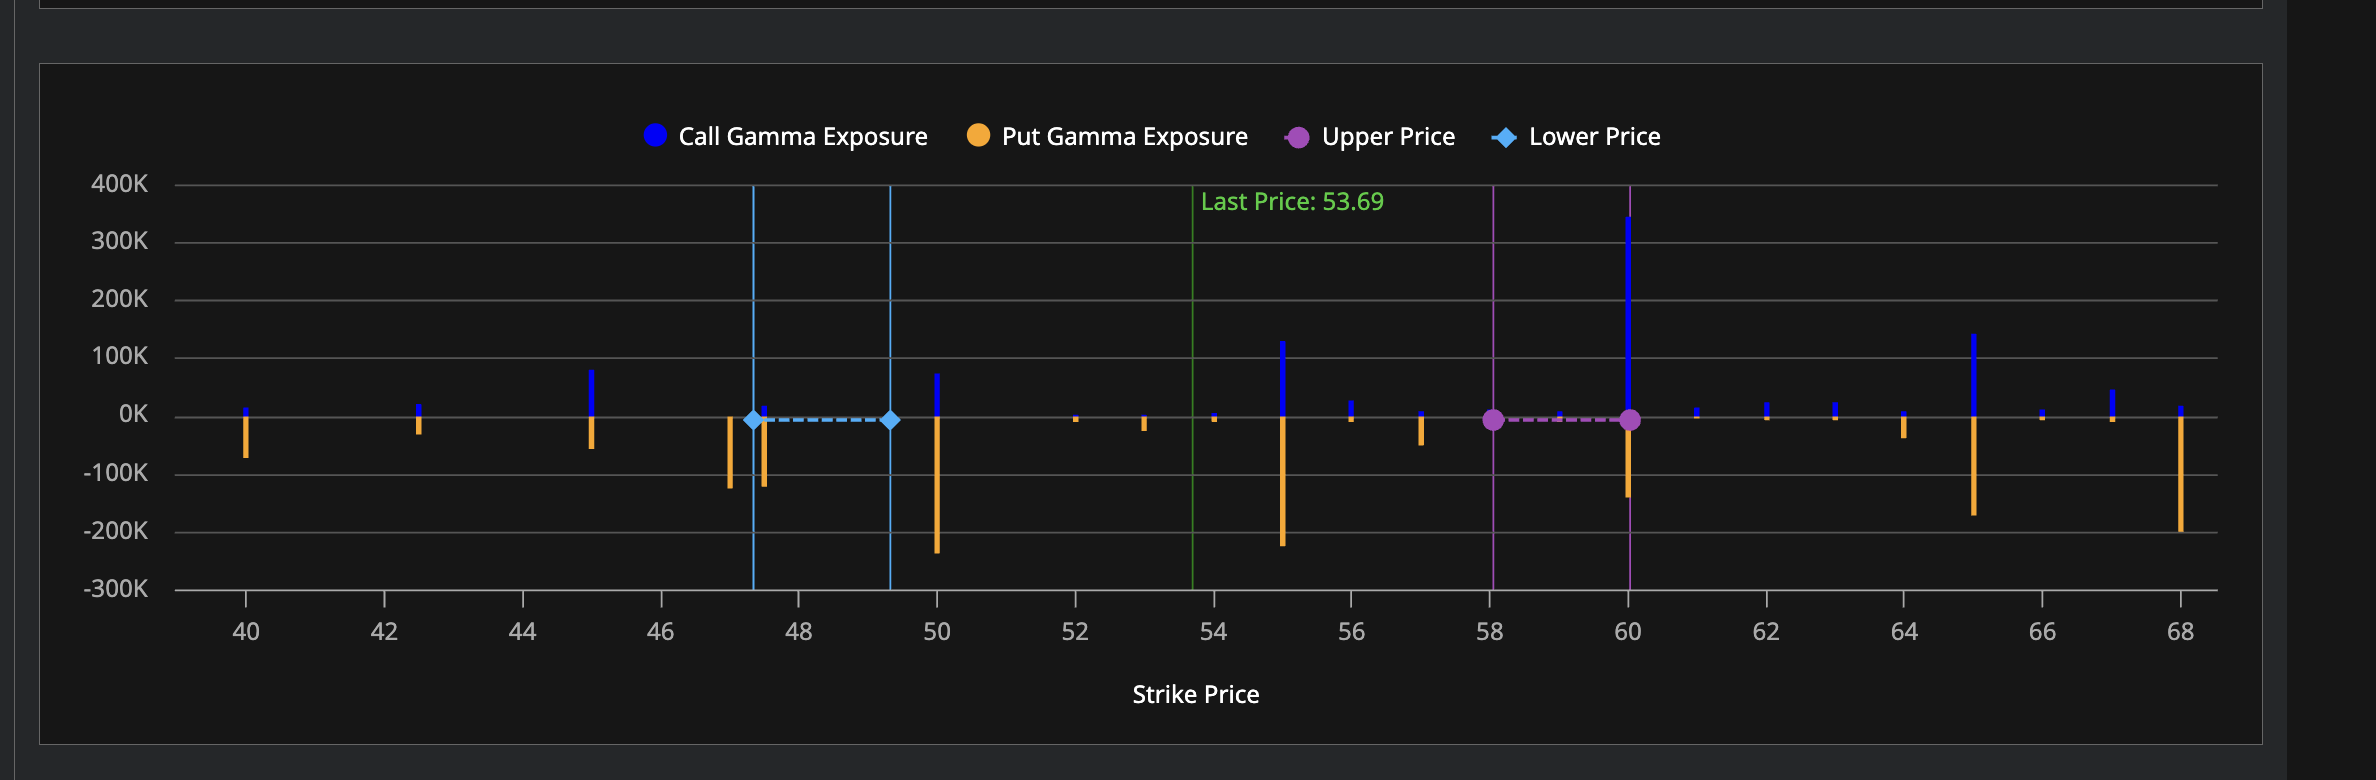
## Gamma Exposure Dynamics
### Call Gamma Concentration
- **$60-61 Strike**: Largest call gamma exposure (>350K contracts)
- **$55-58 Strike**: Moderate call gamma (~100K contracts)
### Put Gamma Concentration
- **$54 Strike**: Heavy put gamma exposure (-250K contracts)
- **$48 Strike**: Secondary put gamma zone (-150K contracts)
- **$64-68 Strike**: Distributed put gamma resistance (-150K to -200K contracts)
### Price Boundaries
- **Upper Price Wall**: $58-60 (purple markers)
- **Lower Price Wall**: $47-48 (blue markers)
## Integrated Technical-Gamma Analysis
The current price of $53.69 sits at a pivotal technical juncture where several forces converge:
1. **Gamma Squeeze Potential**: If UPST breaks above $55.00, market makers will need to hedge call options at the $55-58 strikes, potentially accelerating upward momentum toward the $60-61 gamma wall.
2. **Downside Protection**: The significant put gamma at the $54 strike is creating a "cushion" effect that could slow the current decline, while additional put gamma at $48 forms a stronger floor.
3. **Consolidation Zone**: The interplay between the $52.86 technical support and the $54-55 gamma levels suggests a near-term consolidation zone where price may stabilize.
4. **Volatility Compression**: The narrowing space between upper and lower gamma boundaries indicates a potential volatility squeeze, which often precedes a significant directional move.
## Rule 201 Impact Assessment
Rule 201 (short-sale price test restriction) is active for UPST:
- Short sellers would be limited to selling only on upticks
- This restriction would reduce immediate selling pressure
- The effect would be most pronounced near the $52.86-54.00 zone
- The restriction could provide a temporary floor that aligns with the put gamma support
## Trading Implications
The convergence of technical support at $52.86 with nearby put gamma exposure creates a high-probability inflection pointIPXX--. Market maker hedging activity will likely defend the $53-54 zone due to their put exposure, while simultaneously creating resistance around $58-60 due to their call exposure.
Given the current technical-gamma structure, the highest probability outcome appears to be range-bound price action between $51.50-55.00 in the immediate term, with a potential directional resolution developing once either gamma wall is breached with sufficient volume.
Market Radar delivers concise, daily trading ideas by tracking everything from options activity and market sentiment to high-profile political trades.
Latest Articles
Stay ahead of the market.
Get curated U.S. market news, insights and key dates delivered to your inbox.

Comments
No comments yet