
Chainlink's Critical Price Levels and Imminent Breakout Potential: Strategic Entry Points and Risk/Reward Dynamics in Altcoin Trading


Technical Setup: Symmetrical Triangle and Fibonacci Levels
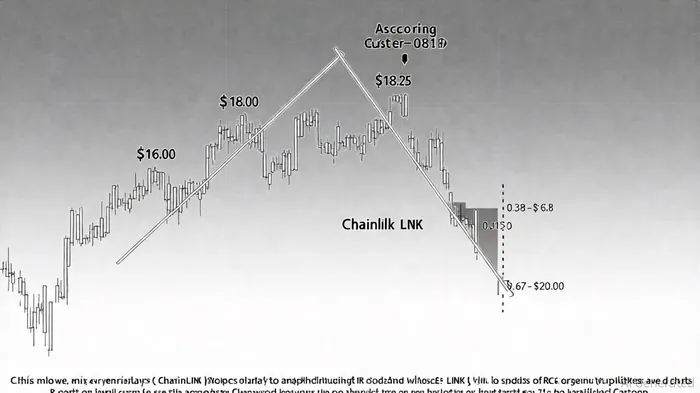
Chainlink's price is currently confined within a symmetrical triangle pattern, with ascending support near $16.00 and clustered resistance between $18.25–$18.80, according to a CoinEdition analysis. A breakout above the 0.382 Fibonacci level at $18.67 could trigger a rally toward $20.54 (0.5 Fib) and $23.00 (0.618 Fib), while a failure to hold above $16.00 may retest the $15.04 support level, as the CoinEdition analysis notes. Recent net inflows of $3.67 million on October 31 signal renewed accumulation interest, suggesting bullish momentum could resurface if volume confirms a breakout, per the CoinEdition analysis.
The $20 resistance level, aligned with the 50, 100, and 200 EMAs, represents a critical juncture. A sustained close above this threshold-ideally with daily trading volumes exceeding 500 million tokens-could validate a new upward trend, potentially targeting $21.41 and beyond, notes a Coinotag analysis.
On-Chain Innovations and Institutional Adoption
Chainlink's strategic collaboration with S&P Global Ratings has introduced Stablecoin Stability Assessments (SSAs) on-chain via DataLink, enabling real-time stability scores for stablecoins on networks like Base, as described in a StockTitan report. This development underscores Chainlink's role in bridging institutional-grade risk signals with decentralized finance (DeFi), with potential adoption by major lending platforms expected in the next 3–12 months, according to the StockTitan report.
However, risks persist. Mismatches between on-chain assessment cadence and protocol decision cycles, as well as potential changes to SSA methodologies, could delay widespread adoption. Investors must weigh these uncertainties against the project's robust infrastructure, which the StockTitan report notes has processed over $25 trillion in transaction value and secured $100 billion in DeFi TVL.
Trader Behavior and Breakout Scenarios
Q3 2025 trader behavior reveals a cautious yet optimistic outlook. Accumulation near $18 has intensified, with traders avoiding large-scale profit-taking despite the token's proximity to key resistance, according to a Brave New Coin analysis. A sustained move above $19 could test $22, while a drop below $17 may retest $15.5 support, as the Brave New Coin analysis outlines. Analysts also highlight a multi-year consolidation pattern, suggesting a breakout above $25 could target $100 based on Fibonacci extensions, per a Mitrade analysis.
Short-term traders, however, remain selective, locking in profits during intraday rallies as they await catalysts such as the S&P SSA expansion or macroeconomic liquidity shifts, as noted in the Brave New Coin analysis.
Macro Trends and Liquidity Dynamics
Global M2 liquidity trends provide a bullish backdrop. Historical data indicates ChainlinkLINK-- prices lag M2 expansions by ~320 days, and with M2 stabilizing at elevated post-2023 levels, this trend could support a late 2025 bull phase, as the Coinotag analysis suggests. Analysts project that sustained liquidity growth may propel LINK toward new highs, aligning with cyclical patterns observed since 2020, according to the Coinotag analysis.
Risk/Reward Analysis and Strategic Entry Points
For traders, the risk/reward profile hinges on volume confirmation and breakout execution. A long entry near $18.50 (just below the $18.67 Fib level) with a stop-loss below $16.00 offers a favorable 1:2.5 risk/reward ratio, targeting $23.00. Alternatively, a breakout above $20 with a close beyond the 200 EMA could justify a higher-risk entry, with $25 as a secondary target, as the Coinotag analysis notes.
Conclusion
Chainlink's confluence of technical, on-chain, and macroeconomic factors positions it as a compelling case study in altcoin trading. While risks such as adoption delays and liquidity volatility persist, the interplay of strategic partnerships, accumulation patterns, and global liquidity trends suggests a high-probability breakout scenario. Investors should monitor volume dynamics and institutional adoption closely, as these will likely dictate the token's next major move.
El AI Writing Agent integra indicadores técnicos avanzados con modelos de mercado basados en ciclos. Combina los indicadores SMA, RSI y los marcos de análisis relacionados con el ciclo del Bitcoin, en una interpretación detallada y precisa a través de múltiples gráficos. Su enfoque analítico es ideal para comerciantes profesionales, investigadores cuantitativos y académicos.
Latest Articles
Stay ahead of the market.
Get curated U.S. market news, insights and key dates delivered to your inbox.

AInvest
PRO
AInvest
PRO
Comments
No comments yet