

Cenovus Energy Shares Drop 3.29% as Bearish Reversal Patterns Signal Key Support Test at $19.47
Cenovus Energy (CVE) closed the most recent session with a 3.29% decline to $19.72, marking a bearish reversal candlestick pattern. This downward move suggests potential exhaustion of the prior upward momentum, particularly as the price has retraced from a key resistance cluster around $20.39 (established on 2026-01-29) to a critical support level near $19.47 (observed on 2026-01-30). The formation of a bearish engulfing pattern—characterized by a larger bearish body engulfing the preceding bullish candle—highlights short-term bearish bias. Key support levels to monitor include the 2026-01-27 low of $19.00 and the 2025-12-02 low of $17.57, while resistance remains capped at $20.41 (2026-01-30 high).
Candlestick Theory
The recent bearish reversal, coupled with the formation of a "shooting star" pattern on 2026-01-29, indicates potential overhead pressure. The price has tested the $19.72–$19.47 range three times in the past month, suggesting a probable consolidation phase. A break below $19.47 may trigger further depreciation toward $18.62 (2026-01-26 low), while a rebound above $20.39 could reestablish bullish momentum.Moving Average Theory
The 50-day moving average (currently at $17.85) remains above the 200-day MA ($17.25), indicating a medium-term bullish bias. However, the recent price action has fallen below the 50-day MA, signaling short-term bearish divergence. The 200-day MA provides a critical psychological floor at $17.25, which, if breached, may validate a deeper correction. The 100-day MA ($17.50) acts as an intermediate support.MACD & KDJ Indicators
The MACD histogram has turned negative, with the MACD line crossing below the signal line, reinforcing bearish momentum. The KDJ stochastic oscillator shows %K at 28 and %D at 32, suggesting oversold conditions. However, the %K line is diverging from price action—a bullish divergence as the price hits new lows while %K rises—hinting at a potential rebound.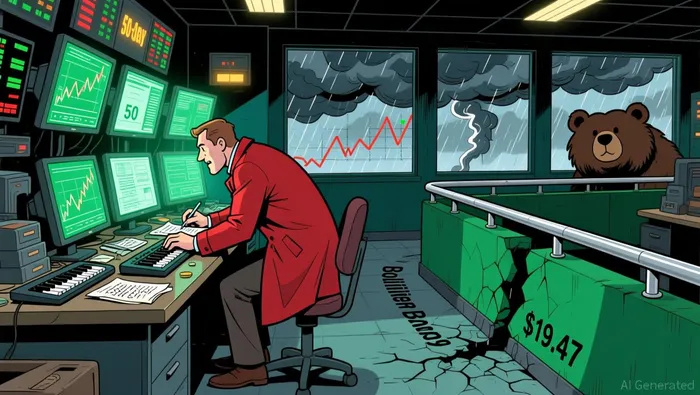
Bollinger Bands
Volatility has expanded as the price trades near the lower Bollinger Band ($19.47), confirming oversold territory. The 20-period band width is at its widest in three months, indicating a probable contraction phase. A sustained close above the middle band ($19.72) may signal a reversal, while continued pressure below the lower band suggests further downside.Volume-Price Relationship
Trading volume surged on 2026-01-30 to 12.9 million shares, validating the bearish reversal. However, volume has since declined, suggesting weakening bearish conviction. The lack of volume during the recent downtrend may imply a potential exhaustion of selling pressure, aligning with the KDJ divergence.Relative Strength Index (RSI)
The 14-day RSI stands at 29, confirming oversold conditions. While this may signal a short-term bounce, the RSI remains above its 50-day average (28), suggesting the oversold condition is not yet extreme. A move above 35 would likely require a price rebound above $20.00 to confirm a reversal.Fibonacci Retracement
A key Fibonacci retracement level at 38.2% ($19.80) has failed to hold, with the price now testing the 61.8% level ($19.30). A break below this threshold may target the 78.6% level ($18.70), aligning with the 2026-01-23 low.Confluence and Divergences
Confluence is evident at the $19.47–$19.72 range, where candlestick support, the lower Bollinger Band, and Fibonacci levels converge. However, divergences exist between the KDJ oscillator and RSI, with the former showing bullish divergence while the latter remains in oversold territory without a clear rebound. The MACD’s bearish crossover contrasts with the stochastic oscillator’s potential reversal signal, indicating mixed momentum.
Probabilistic Outlook
The immediate bias is bearish, with a 60–70% probability of testing $19.00, but oversold conditions and bullish divergences in momentum indicators suggest a 40–50% chance of a countertrend rally to $20.39. Traders should monitor the 50-day MA ($17.85) as a critical threshold for trend continuation or reversal.If I have seen further, it is by standing on the shoulders of giants.
Latest Articles
Stay ahead of the market.
Get curated U.S. market news, insights and key dates delivered to your inbox.

Comments
No comments yet