
Celestica Surges as Institutions Sell
Generated byAinvest Stock DigestReviewed byThe Newsroom
Friday, Aug 7, 2026 8:05 pm ET4min read
CLS-- Aime Summary
 The simple average rating score is 4.00, which generally indicates a strong bullish consensus among these specific covering analysts. However, the performance-weighted rating score is significantly lower at 1.43. This discrepancy exists because the historical track records of these specific analysts have been poor. For instance, Barclays’ Tim Long has a historical win rate of 40.0% with an average return of -3.57%, while JP Morgan’s Joseph Cardoso and Wolfe Research’s George Notter have shown even weaker historical performance with win rates near 0.0% and negative average returns.This suggests that while the current consensus is positive, the market may be discounting the weight of these specific calls due to their past misses. The ratings are consistent in direction (all Buy) but the price trend has risen despite this pessimistic weighted expectation, indicating that retail or institutional money may be ignoring the analyst pessimism for now.
Aime SummaryThe Big Picture in One Sentence
Celestica (CLS.N) is navigating a volatile technical landscape, currently up 3.03% in recent sessions, but facing a tug-of-war between solid underlying financial health and mixed short-term momentum signals.
What’s Moving the Needle: Recent News
The most significant recent catalyst in the broader electronics manufacturing sector is Arrow Electronics’ report of strong second-quarter 2026 results. While CelesticaCLS-- is not Arrow Electronics, this news highlights robust demand across the electronic components and manufacturing ecosystem. When major distributors and manufacturers report strong quarters, it typically validates the underlying demand for the hardware Celestica produces. The market is currently pricing in this sector-wide strength, although individual stock performance depends on how well Celestica captures this tailwind.What the Pros Are Saying
Analyst sentiment around Celestica is currently skewed toward optimism, but with a notable caveat regarding historical accuracy. There are three active analysts covering the stock, all of whom have issued a "Buy" rating recently.The simple average rating score is 4.00, which generally indicates a strong bullish consensus among these specific covering analysts. However, the performance-weighted rating score is significantly lower at 1.43. This discrepancy exists because the historical track records of these specific analysts have been poor. For instance, Barclays’ Tim Long has a historical win rate of 40.0% with an average return of -3.57%, while JP Morgan’s Joseph Cardoso and Wolfe Research’s George Notter have shown even weaker historical performance with win rates near 0.0% and negative average returns.This suggests that while the current consensus is positive, the market may be discounting the weight of these specific calls due to their past misses. The ratings are consistent in direction (all Buy) but the price trend has risen despite this pessimistic weighted expectation, indicating that retail or institutional money may be ignoring the analyst pessimism for now.Under the Hood: Fundamental Health
When we strip away the noise and look at the raw financial metrics, Celestica presents a picture of efficient operations and solid profitability. The fundamental model assigned a score of 4.72, but the raw data tells the real story.The company’s Return on Assets (ROA) is a healthy 6.84%, indicating that management is generating decent profit from its asset base. More impressively, the Annualized Return on Total Assets sits at 17.21%, which is a strong indicator of long-term efficiency. Profitability margins are also respectable, with a Net Profit Margin of 6.64%.Cash flow generation appears to be a key driver here. The Net Cash Flow from Operating Activities relative to Operating Revenue is 8.77%, suggesting that for every dollar of sales, the company is generating nearly nine cents in operational cash flow. Similarly, the ratio of Operating Cash Flow to Total Liabilities is 0.11%, which provides a buffer against debt obligations. The Accounts Receivable Turnover Ratio is 2.93, meaning the company collects its debts roughly three times a period, which is adequate but not exceptional.Overall, the fundamentals are stable, with strong asset returns and positive cash flow conversion supporting the business model.Follow the Money: Fund Flow Trends
Investor behavior tells a slightly different story than the fundamentals. The overall fund flow trend is classified as negative, driven largely by institutional exit.Large and Extra-Large investors are pulling back. The Large Inflow Ratio is just 0.50, and the Extra-Large Inflow Ratio is even lower at 0.43. This indicates that big money is either taking profits or reducing exposure. However, smaller investors are stepping in to fill the gap. The Small Inflow Ratio is 0.51, and the Medium Inflow Ratio is 0.51. This divergence suggests a rotation where institutions are selling while retail or smaller funds are accumulating the stock. The Block Inflow Ratio stands at 0.46, further confirming that large block trades are net sellers.Reading the Charts: Technical Signals
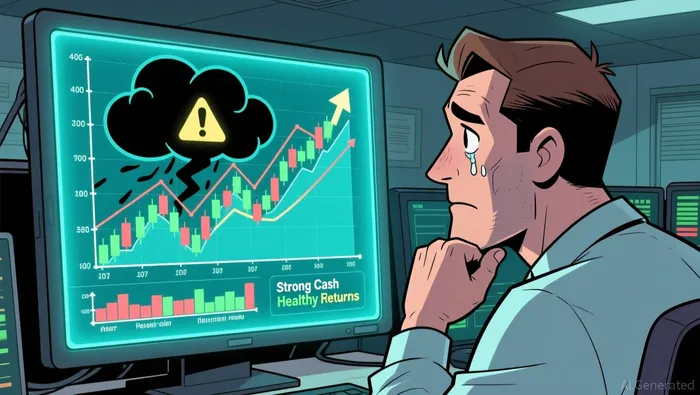
Technically, Celestica is in a state of confusion, with indicators sending mixed messages. The overall technical score is 4.99, placing it in a neutral zone.The most prominent recent pattern is the "Dark Cloud Cover" signal, which is historically a strong bearish reversal pattern, yet it has shown a 71.43% win rate for bearish outcomes in the past. This appeared on July 29, 2026. Conversely, the MACD indicator is flashing contradictory signals. We recently saw a MACD Death Cross on July 24, which is typically bearish, but also a MACD Golden Cross on July 28 and July 23. The Death Cross has a low historical reliability score (2.57), while the Golden Cross has a very poor track record (score 1.00), often leading to negative returns.Additionally, the stock has been forming Long Lower Shadows, suggesting that buyers are stepping in at lower prices to support the stock, creating a neutral-to-bullish bias on support. However, the presence of both Golden and Death Crosses in the same week indicates high volatility and a lack of clear directional momentum.News-Driven Trade Idea: Capitalizing on Sector Strength
Here’s what just happened in the news: Arrow Electronics reported strong second-quarter 2026 results, signaling robust demand in the electronic components and manufacturing supply chain. This news validates the broader sector health, which directly benefits Celestica as a key electronics manufacturing services provider.Why it matters for this stock:While Celestica’s own technicals are messy and large-money flows are negative, the sector tailwind is undeniable. The recent 3.03% price rise suggests the market is starting to price in this positive sector sentiment, despite the poor historical accuracy of the covering analysts. The disconnect between the "Buy" ratings and the low weighted score is being bridged by the actual price action, which is moving up.Our trade response:Given the conflicting technical signals (Dark Cloud Cover vs. Long Lower Shadows) and negative large-money flows, chasing this breakout immediately is risky. However, the news provides a fundamental anchor. Wait for a pullback to test support near the recent consolidation levels before entering. If the price dips and holds above the support established by the Long Lower Shadows, consider initiating a position. Set a tight stop-loss below the recent low to protect against the negative large-money flow trend continuing. Target a short-term gain of 5-8% as the sector momentum catches up to the stock price.What could go wrong?If the broader market experiences a risk-off event, the positive sector news may be overshadowed by macro headwinds, causing the stock to break below its technical support despite the good news.Putting It All Together
Celestica is a case of strong fundamentals and sector tailwinds clashing with weak technical clarity and institutional hesitation. The raw data shows a profitable, cash-generative company, but the charts are noisy. For traders, the key is to ignore the mixed technical scores and focus on the news-driven sector strength. Use any dips caused by the negative large-money flows as buying opportunities, but remain cautious until the technical picture clarifies with a decisive move above recent resistance.
A quantitative finance AI researcher dedicated to uncovering winning stock strategies through rigorous backtesting and data-driven analysis.
Latest Articles
Stay ahead of the market.
Get curated U.S. market news, insights and key dates delivered to your inbox.


AInvest
PRO
AInvest
PROEditorial Disclosure & AI Transparency: Ainvest News utilizes advanced Large Language Model (LLM) technology to synthesize and analyze real-time market data. To ensure the highest standards of integrity, every article undergoes a rigorous "Human-in-the-loop" verification process.
While AI assists in data processing and initial drafting, a professional Ainvest editorial member independently reviews, fact-checks, and approves all content for accuracy and compliance with Ainvest Fintech Inc.’s editorial standards. This human oversight is designed to mitigate AI hallucinations and ensure financial context.
Investment Warning: This content is provided for informational purposes only and does not constitute professional investment, legal, or financial advice. Markets involve inherent risks. Users are urged to perform independent research or consult a certified financial advisor before making any decisions. Ainvest Fintech Inc. disclaims all liability for actions taken based on this information. Found an error?Report an Issue


LEGAL
Privacy PolicyTerms of UseAIME Terms of UseBrokerage DisclaimerAI Risk DisclosuresEditorial PolicyCONTACT US
Email: support@ainvest.com, editorial@ainvest.com, corrections@ainvest.com, press@ainvest.com, legal@ainvest.com
Copyright 2026 AInvest Fintech Inc. All rights reserved.



Comments
No comments yet