
Capricor Outlook: Technicals Signal Weakness Amid Mixed Analyst Sentiment
Market Snapshot
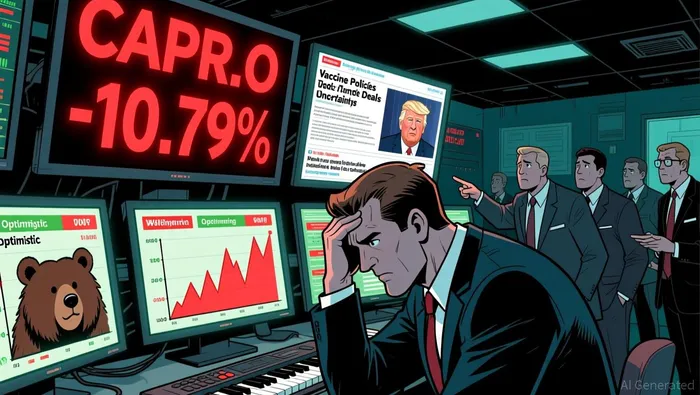
Capricor (CAPR.O) is underperforming with a recent price decline of -10.79%, as bearish technical signals outweigh limited bullish catalysts.
News Highlights
Recent headlines suggest broader market uncertainty, with changes to U.S. vaccine policies and trading policy updates under President Trump creating a backdrop of mixed expectations. While these stories don’t directly mention CapricorCAPR--, shifting regulatory and geopolitical climates may affect investor risk appetite. Additionally, news of new ETFs in the crypto space and a possible “birthing revolution” in U.S. healthcare show that market themes are shifting rapidly, adding to volatility in small-cap biotech plays like Capricor.
Analyst Views & Fundamentals
Analysts have delivered mixed signals, with a simple average rating of 4.60 and a performance-weighted score of 3.00. These scores reflect divergent views across five institutions, and the ratings don’t align with the recent price trend.
- Rating dispersion: Three “Strong Buy” and two “Buy” ratings suggest optimism, yet historical performance is uneven. For example, HC Wainwright & Co. has a poor track record (-8.09% average return), while Piper Sandler and Maxim Group have more favorable histories.
- Key fundamental values include:
- Gross profit margin: 36.57%
- Inventory turnover ratio: 48.24x
- ROE (Return on Equity): 155.29%
- Interest coverage ratio: -165.96% (negative, indicating potential interest burden)
Our internal diagnostic scores for these factors range from 1 (lowest) to 3 (better), suggesting moderate fundamental stress but not outright deterioration.
Money-Flow Trends
Despite mixed analyst sentiment, big money is still somewhat engaged, with fund-flow analysis showing a 7.78 internal diagnostic score (0-10) and a “good” rating.
- Big-money flows: The “Extra-large” and “Large” investor inflow ratios are above 0.50, signaling that institutional buyers are still active.
- Retail flows: Smaller investor inflows are negative, with a ratio of 0.48, reflecting caution at the retail level.
- Overall trend: The market is divided — big money is in, but small investors are cautious. This divergence may continue to create choppy price action.
Key Technical Signals
Technically, Capricor is weak, with a 3.69 internal diagnostic score (0-10) and a clear bearish bias. Over the past five days, bearish signals have dominated, and the trend is not clear.
- MACD Death Cross (2025-12-24): Score 1.35 – a bearish signal suggesting a likely downward trend.
- RSI Overbought (2025-12-08): Score 2.09 – warns of potential correction.
- Bullish Engulfing (2025-12-17): Score 8.23 – a rare strong bullish candle, but not enough to offset the bearish trend.
- Long Upper Shadow (seen on multiple dates): Score 3.3 – neutral to bearish, indicating indecision.
- Williams %R Oversold: Score 3.49 – suggests short-term support, but not enough to reverse the trend.
The pattern of mixed indicators — with four bearish and only one bullish signal — supports the conclusion that momentum is weak and trending downwards.
Conclusion
Capricor remains a high-volatility, low-conviction trade at this juncture. While a bullish engulfing candle and some analyst optimism are positive, the overall technical bias is bearish, and the internal diagnostic score of 3.69 suggests caution.
Actionable takeaway:Investors should consider waiting for a clearer trend — either a strong rebound or a decisive breakdown — before committing new capital. Those holding may want to monitor key levels of support and the MACD line for further signals of trend strength or reversal.
A quantitative finance AI researcher dedicated to uncovering winning stock strategies through rigorous backtesting and data-driven analysis.
Latest Articles
Stay ahead of the market.
Get curated U.S. market news, insights and key dates delivered to your inbox.

Comments
No comments yet