
Buffett Indicator Hits Historic High! Outdated Metric or Warning Signal?
Both the S&P 500 and Nasdaq Composite indexes reached new all-time highs yesterday. Stock markets are looking extremely high, so tread carefully.
The Warren Buffett Indicator, which divides the total market capitalization (We use the S&P 500) of a country's stock market by its annual GDP, attempts to gauge whether the market is overvalued or undervalued. Currently, this ratio stands close to its all-time high, surpassing the levels seen during the 2000 dot-com bubble crash and the 2008 Financial Crisis.
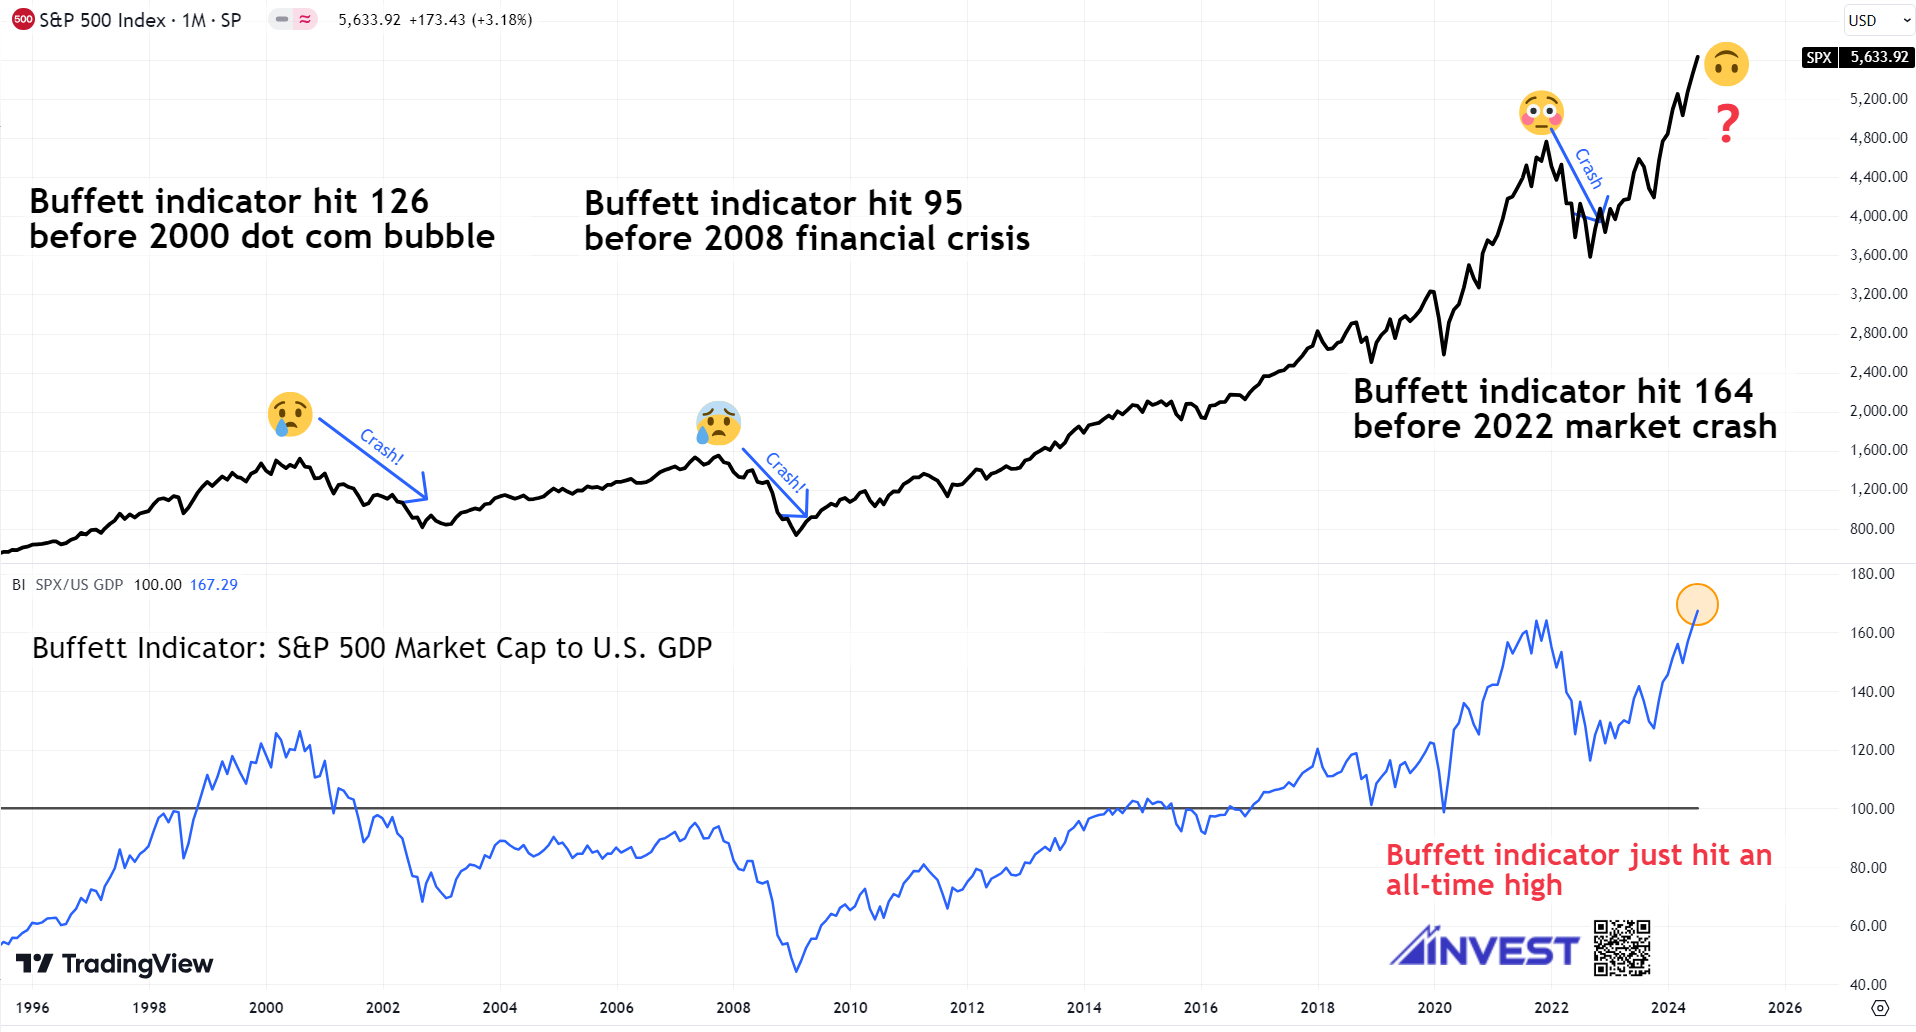
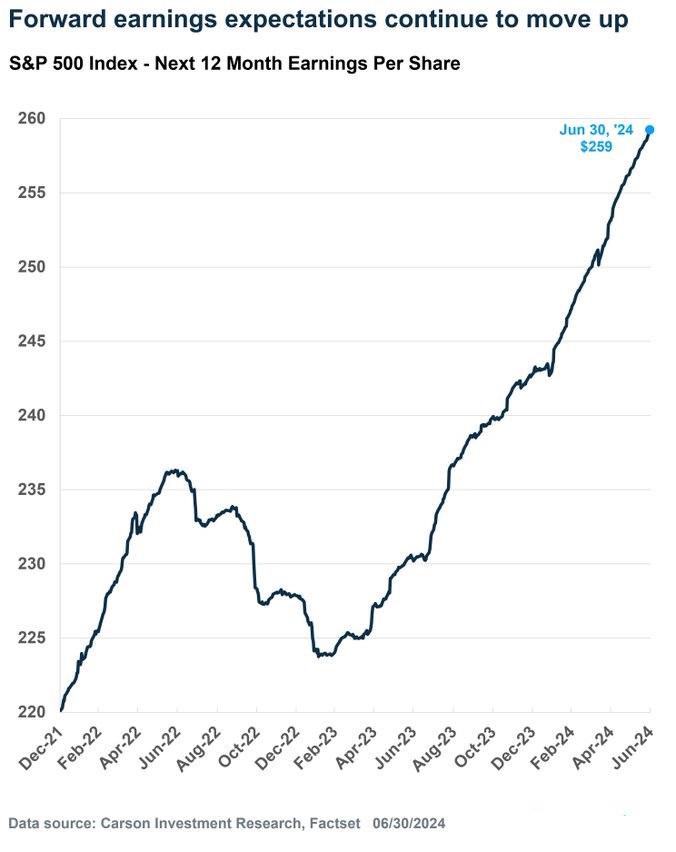
However, corporate EPS growth remains strong, suggesting that although companies may appear overvalued now, these multiples could align with reality as earnings continue to rise. Forward earnings expectations have consistently increased over the past few years, potentially explaining why investors are willing to pay high premiums for stocks at current prices.
 Shortcomings for Buffett Indicator
Despite its strengths, the Buffett Indicator also has limitations. One significant issue is that many large companies derive substantial profits from international markets, which could make GDP a less relevant measure.
Another current concern is that a few dominant mega-cap stocks have driven most of the market's gains over the past 18 months. This situation implies that the indicator might overlook the fact that many stocks are still inexpensive compared to historical norms, while a small number are excessively costly.
Moreover, the indicator does not take into interest rates.
Stay ahead of the market.
Get curated U.S. market news, insights and key dates delivered to your inbox.


AInvest
PRO
AInvest
PRO
Comments
No comments yet