
BTTC/USDT Consolidates: Buyers Defend 2.6e-07 Support
 Aime Summary
Summary
- BitTorrent/Tether trades in a tight range between 2.6e-07 and 2.7e-07.
- Persistent doji candles with long lower shadows indicate strong buying interest at lows.
- 24-hour volume is significantly below the 7-day and 15-day historical averages.
- Price remains range-bound with no clear directional breakout signals currently visible.
- Market structure suggests consolidation, with support holding firm against minor sell pressure.
Range Consolidation
BitTorrent/Tether (BTTCUSDT) closed the latest 1-hour candle at 2.7e-07, reflecting a narrow 24-hour trading range between 2.6e-07 and 2.7e-07. The total 24-hour volume recorded approximately 2.3e+11 USDT, indicating subdued participation relative to recent history.
1-Hour Support/Resistance and Candlestick Patterns
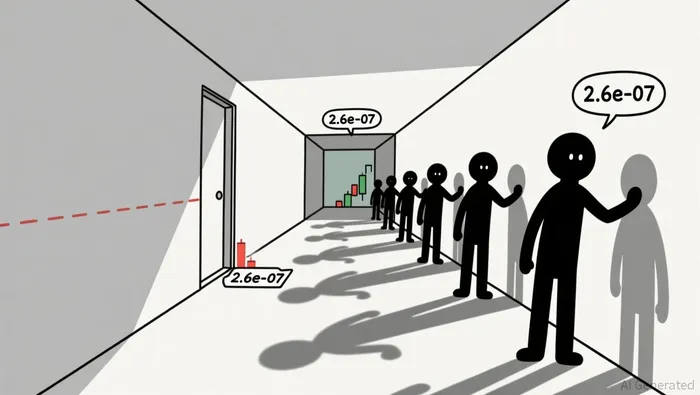
The asset is currently trading in a confined range with key support established at 2.6e-07 and resistance at 2.7e-07. Price action has repeatedly tested the lower boundary, with multiple hourly candles rejecting the 2.6e-07 level. The candlestick analysis reveals a dominant pattern of consecutive dojis with long lower shadows, particularly evident from July 31 through August 1. These patterns suggest that sellers are pushing prices down, but buyers consistently step in to absorb the selling pressure, creating wicks that are significantly longer than the candle bodies. This indicates a balance between supply and demand, with the market appearing closer to the resistance level due to the repeated rejections at the lower support zone. The lack of strong bullish engulfing candles suggests that upward momentum is currently weak.
Volume and Turnover vs. Historical Comparison
The 24-hour total volume of approximately 2.3e+11 USDT is markedly lower than both the 7-day average daily volume of 7.06e+11 USDT and the 15-day average of 7.33e+11 USDT. This significant drop in turnover suggests a lack of conviction from major market participants. When examining hourly volume spikes, the highest recorded volume in the recent 15-day window occurred on July 25, reaching 6.39e+11 USDT, which was accompanied by a 7.69% price increase. In contrast, the current 24-hour period shows no single hour exceeding twice the average hourly volume of 2.94e+10 USDT derived from the 7-day data. The absence of high-volume follow-through on recent price dips implies that the current consolidation is driven by low liquidity rather than active institutional accumulation or distribution. The volume anomalies do not appear to be driving significant price direction at this time.
Look Back: Current Market Phase
Analyzing the 7-15 day market structure reveals that the price has been moving sideways within a narrow range. The 7-day price change is recorded at -3.57%, while the 3-day change is 0.0%, indicating a stabilization after a minor decline. The market structure feature is explicitly identified as range-bound. There are no clear higher highs or lower lows to suggest a strong downtrend or uptrend. The current phase appears to be a consolidation period following the volatility seen in late July. This sideways movement suggests that the market is accumulating energy or waiting for a catalyst to break the current equilibrium. The lack of a significant trend over the past week supports the view that the market is in a neutral, range-bound phase.
The market is likely to continue consolidating in the near term, with prices ranging between 2.6e-07 and 2.7e-07. A break below 2.6e-07 could expose further downside risk, while a sustained move above 2.7e-07 might signal the start of an upward correction.

Decoding market patterns and unlocking profitable trading strategies in the crypto space
Latest Articles
Stay ahead of the market.
Get curated U.S. market news, insights and key dates delivered to your inbox.


AInvest
PRO
AInvest
PRO




Comments
No comments yet