
BTI Broke Its 200-Day—The Line That Decides Burry's Big Tobacco Bet
 Aime Summary
Deck: The "Big Short" investor's biggest stock bet is a cigarette giant, and the chart just turned against him. Everything now runs through one zone.
The story making the rounds on the tape is almost too neat: an investor who spent decades smoking turned the habit into money riding the companies that sold him the cigarettes. Michael Burry, who shorted the housing market a decade before the movie made him famous, has made tobaccoBTI-- a signature bet for years—and British American TobaccoBTI-- (NYSE: BTI) has repeatedly shown up as his single largest stock holding in his regulatory filings. That is the setup.
Here is the part the headline leaves out. The chart is currently winning the argument against him.

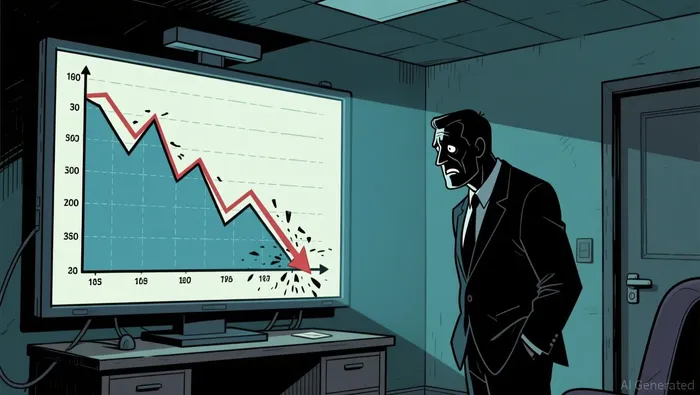
As of the Sep 8 close, BTI sits at $55.15, below its 50-day average of $58.95 and its 200-day average of $59.15, with an RSI near 38—comfortably in the weak half of the tape. YTD the stock is down about 2.6%, and over the past 120 days it has lost almost 9%. This is not a fast-moving momentum name. It is a high-yield defensive stock whose chart is delivering a slow, steady verdict: the buyers who pushed it up are losing control, and the dividend crowd is the only thing holding a floor underneath it.
What just broke
The point of damage was the half-year report on July 30. On the surface the numbers look fine. Adjusted EPS came in at $1.68, a fraction ahead of the $1.66 analysts expected, and management nudged its 2026 adjusted EPS guidance to the middle of its 5%–8% range. Revenue was the wrinkle: $12.24 billion came in just short of the $12.33 billion forecast. Unspectacular, but enough for the stock to fall more than 3% on the release.
From there the chart did the mechanical thing. BTI, which had run toward the upper end of its 52-week range at $67.30, rolled over, crossed below its 50-day average, and in recent sessions sliced through the 200-day as well. The 20-day move is now negative 3.3%. The stock has gone from the crowd's favorite value idea to a breakdown in progress, and it is doing it on a name where the yield is the whole thesis.
That matters because of who is trapped. Anyone who bought the late-July enthusiasm near the highs is now underwater with price below both averages. The natural reflex for a dividend investor—buy the dip for the yield—is exactly what keeps resource from printing catastrophic lows, but it is not the same as a technical reclaim. A defensive buyer who holds through a 200-day break is betting on the yield to save them, not on the chart.
The new category is the quiet counter-argument
The bearish tape is not the whole story, and that is what makes the level interesting rather than a foregone conclusion. BTI's legacy cigarette business is shrinking, but the smokeless transition is real: management now expects new-category revenue to grow at a mid-teens clip for the year, with Velo (modern oral) taking another chunk of U.S. share and Vuse (vapour) adding value share stateside. This is the "good news buried in a weak report" dynamic—the market sold the revenue miss and the tepid guidance, leaving the repositioning story to be re-priced later.
So the question is whether that longer-term case can show up on the chart before the value floor gives way.
The line that changes the odds
For BTI, there are two verifiable markers, and the space between them is narrow enough to make them a real decision.
On top, the ~$59 zone—the 50- and 200-day averages sit nearly on top of each other around $58.95–$59.15. That is not a round number invented from today's quote; it is the level the breakdown was rejected to, the same panel of moving averages that stopped the slide. A close back above $59 with volume expanding would flip this from a breakdown into a trapped-sellers reclaim, and it would put the next leg toward the mid-$60s gap back on the map.
On the bottom, the 52-week low at $49.88. That is the structural floor—nine and a half percent below where BTI trades now. Break it and the dividend-buyer rationale stops acting as support and starts acting as a magnet, because the yield climb alone will not halt a chart that has lost its anchor.
| Scenario | Trigger | Path | Invalidation | Horizon |
|---|---|---|---|---|
| Bullish reclaim | Close above ~$59 on rising volume | Return toward the $62–63 zone, then the upper range | Rejection back below $56 | Weeks |
| Bearish continuation | Hold below $55, then lose ~$53 | Slide toward the $50 area / $49.88 52-week low | Strong reclaim of $59 | Weeks |
The verdict
Holding $50 keeps the yield story alive as a slow, grinding value play. Losing $49.88 makes the chart the boss, and no dividend—Burry's conviction included—overrules a floor that has broken.
This is the honest shape of the setup: it is not a breakout begging to be chased, and it is not a collapse begging to be shorted. It is a defensive name caught between a downtrend and a dividend floor, where the winner is whichever side takes the easiest level first. Until BTI reclaims $59 with participation, the momentum case owns the tape, and Burry's famous bet is a bet waiting on a chart to stop fighting it.
Data as of intraday Sep 8, 2026, 5:13 p.m. ET. BTI prices are US ADR prints; cited price levels are rounded from live market data and are decision markers, not targets.

Stay ahead of the market.
Get curated U.S. market news, insights and key dates delivered to your inbox.


AInvest
PRO
AInvest
PRO




Comments
No comments yet