
BTCUSD1 Stalls Near $73,195 as Mixed Momentum Clouds Breakout Prospects
Summary• BTCUSD1 trades in a tight range between $71,479 and $73,195 after testing key resistance.• Momentum indicators show mixed signals with RSI hovering near neutral levels.• Volume spikes at $73,195 suggest distribution, while lower turnover indicates consolidation.• Price action respects the 50-period moving average as a dynamic support zone.• A potential double top formation may signal a short-term reversal if support breaks.
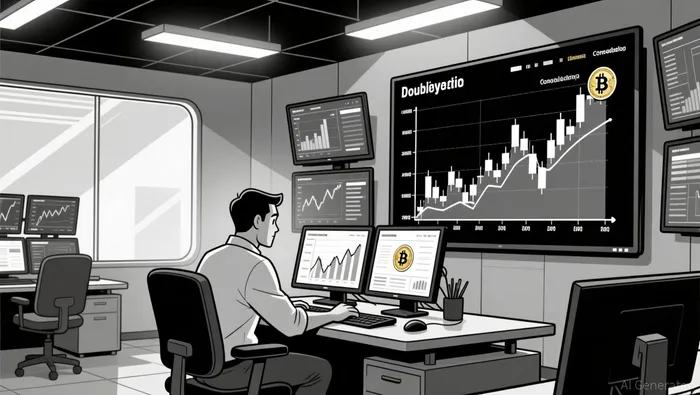
The Bitcoin/World Liberty Financial USD (BTCUSD1) pair opened at $71,939.62 and closed at $71,503.55, establishing a 24-hour high of $73,195.43 and a low of $71,479.91. Total trading volume reached approximately 1,560 units with a notional turnover of roughly $112 million during the observed window.
Price Structure and Key Levels
Price action appears to have formed a local top near $73,195 before retreating into a consolidation zone. The 5-minute chart suggests that $72,200 could act as immediate resistance, while the $71,500 area serves as a critical support level that has been tested multiple times. A break below $71,479 might invalidate the current bullish structure, whereas holding above $71,800 could allow for a retest of the $72,400 range.
Momentum and Oscillators
The Relative Strength Index (RSI) appears to be drifting back toward the neutral 50 mark, indicating that neither overbought nor oversold conditions currently dominate the market. MACD lines show a potential crossover forming, which could signal a shift in short-term momentum if volume confirms the move. Traders should watch for divergence between price highs and oscillator values, as this may hint at a weakening trend.
Volatility and Volume Dynamics
Bollinger Bands indicate a period of volatility contraction following the initial surge to $73,195, suggesting that a significant expansion may be imminent. Volume analysis reveals that the highest turnover occurred during the rally to the peak, but subsequent price declines were accompanied by lower volume, which might imply a lack of aggressive selling pressure. However, the spike at the top could also represent distribution by early buyers.
Fibonacci and Future Outlook
Applying Fibonacci retracement levels to the recent swing suggests that the $72,400 area aligns with the 38.2% retracement, acting as a potential pivot point. If the price fails to reclaim this level, the next support target could lie near the 61.8% level around $71,600. In the coming 24 hours, the market may test the lower band of the Bollinger Bands, but a sudden surge in volume could alter this trajectory. Investors should remain cautious of potential whipsaws near key psychological levels.
Decoding market patterns and unlocking profitable trading strategies in the crypto space
Latest Articles
Stay ahead of the market.
Get curated U.S. market news, insights and key dates delivered to your inbox.


AInvest
PRO
AInvest
PRO
Comments
No comments yet