
BTC at a Macro Crossroads: ETF Outflows, Miner Capitulation, and the Fed's Hawkish Stance — August 3, 2026
 Aime Summary
Executive Summary: BitcoinBTC-- is consolidating near $63,000 after a volatile week marked by $265M in single-day ETF outflows, a 14% drawdown in mining difficulty from 2026 highs, and a Fed that left rates unchanged but signaled a ~63% probability of a September hike. On-chain valuation remains neutral (MVRV 1.22), but the macro backdrop — rising yields, a firm dollar, and crowded retail longs — creates a fragile setup. The path of least resistance points lower unless spot demand returns.
BTC Daily Briefing
Supply & Demand
- Halving cycle position: ~846 days post-halving (April 2024), block 960,588 of 1,050,000 (57.4% through cycle 5). Next halving estimated ~April 21, 2028. (Source: coinwarz.com)
- Whale activity: No significant fresh accumulation or distribution data available from search results. However, retail positioning on Binance BTCUSDTBTC-- shows 68.7% long accounts vs. 31.3% short (long/short ratio 2.19), a crowded long setup that historically signals vulnerability to long squeezes. (Source: coinstats.app)
- MVRV Ratio: 1.22 as of July 28, 2026. Realized price estimated at ~$52,442. MVRV Z-Score at 0.38 — well below the historical euphoria zone (1.0+) and above the capitulation zone (<0). Short-term holder MVRV at 0.94 (below cost basis), long-term holder MVRV at 1.29 (above cost basis). (Source: ahasignals.com)
- Miner Economics: Mining difficulty at 126.23T, down ~14% from the January 2026 peak and ~19.1% from the November 2025 all-time high of 155.97T. Hashprice at $27.66/PH/day — a historic low. This is only the second year-over-year difficulty decline in Bitcoin history (the first was China's 2021 mining ban). Forward markets suggest miners expect little revenue recovery through end-2026. (Source: coindesk.com, lcx.com, pluang.com)
DAT Financials (BTC)
- MSTR (Strategy): Stock closed at $93.28 on Aug 2, down 4.56% on the day, 52-week range $81.81–$414.36. Market cap ~$32.69B. Holdings: 843,775 BTC (4.02% of total supply). Average purchase price: $66,384.56/coin. Current unrealized loss vs. cost basis: approximately $2.5B at spot $63k. Q2 2026 reported a net loss of $8.22B due to impairment charges on BTC holdings. The company raised $8.4B in Q2 alone and bought 174,895 BTC YTD (net of 3,620 sold). Michael Saylor signaled willingness to sell BTC to support the STRC dividend if necessary, stating "if it took an extra $4 billion, spend $4 billion." (Source: tradingview.com, robinhood.com, finance.yahoo.com, bitbo.io)
Macro & Liquidity
- 10Y Treasury: 4.74% on July 31 — highest since January 2025, up 26bps over the month. 2Y Treasury: 4.29%. Curve: Steep (45bps spread between 2Y and 10Y), with 30Y surging to 5.23% — highest in 19 years. (Source: tradingeconomics.com, streetstats.finance)
- Fed: Held rates at 3.50%–3.75% on July 29 (5th consecutive hold). Vote split 9–3, with three FOMC members (Kashkari, Hammack, Logan) dissenting for a 25bps hike. Next meeting: September 16. CME FedWatch implies ~63% probability of a 25bps hike in September. Chair Warsh dropped explicit forward guidance. (Source: tradingeconomics.com, cmegroup.com, cbsnews.com)
- Liquidity: Macro environment is restrictive. SOFR and RRP data not available from search results, but the 10Y at 4.74% and 2Y at 4.29% create a high discount-rate headwind for risk assets.
- DXY: 99.9 on July 31, down ~1.6% over the month. 52-week range 95.55–101.80. Consensus forecasts point to a softening bias into the mid-90s by year-end — a modest tailwind for BTC if it materializes. (Source: cambridgecurrencies.com, tradingeconomics.com, cnbc.com)
ETF Flows
Data from Farside Investors, as of July 31, 2026 (source: farside.co.uk, kucoin.com):
| ETF | Net Flow (July 31) | July Total |
|---|---|---|
| IBIT (BlackRock) | -$122.7M | +$227.6M |
| FBTC (Fidelity) | -$54.8M | -$209.5M |
| GBTC (Grayscale) | -$52.6M | -$360.4M |
| BITB (Bitwise) | -$17.8M | — |
| ARKB (ARK) | -$17.5M | — |
| BTC Total | -$265.4M | +$172.8M |
The July 31 outflow was the largest single-day redemption since late July, reversing two consecutive inflow days totaling ~$123M. The preceding week saw a net outflow of $61.5M. Cumulative net inflows since launch stand at $51.4B. IBIT cumulative inflows remain dominant at $60.5B.
Technical Analysis
1h Chart (data as of Aug 2, via investtech.com):- Trend: Weak positive. BTC broke the floor of a short-term rising trend channel. A head and shoulders pattern triggered a breakdown through support at $64,232, with a measured move target toward $61,906.- Support: $63,300 (tested), $62,552 (short-term trading range low), $61,906 (H&S target)- Resistance: $64,232 (broken support now resistance), $66,000- RSI: Falling trend, momentum negative- MACD: Bearish signal, no crossover yet
Daily Chart:- Trend: Bearish medium-term. BTC is in a falling trend channel. The currency has broken down through the $74,000 support zone (now resistance).- Support: $63,000 (horizontal), $55,075 (long-term H&S neckline, measured move to ~$30,453 if broken)- Resistance: $66,224 (long-term trading range), $74,000 (broken support)- 50 DMA: Not available directly from search, but price is well below the 200 DMA which has been rising since July 29, 2026 (source: changelly.com)- RSI: Falling trend, supporting the negative medium-term bias- Overall: Investtech algorithm scores BTC at -48 (Weak Negative) overall, -93 (Negative) on the long-term horizon. (Source: investtech.com)
Forward View
Bias: BEARISH near-term, NEUTRAL medium-term
The confluence of three forces creates a fragile setup for BTC heading into the first week of August:
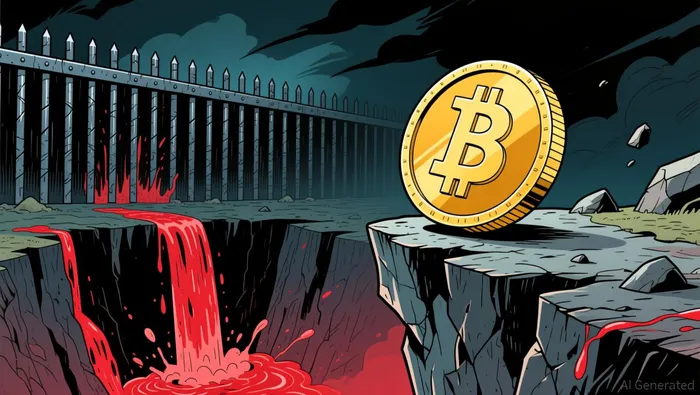
- ETF outflows accelerated — The $265M July 31 outflow was the largest single-day redemption in weeks, concentrated in the largest products (IBIT, FBTC, GBTC). If this extends into a multi-day streak, it removes the primary institutional demand channel that held BTC above $60k.
- Miner capitulation signal — The 14% difficulty decline from the January peak and hashprice at $27.66/PH/day are historic bearish signals. Only once before (China 2021 ban) has difficulty fallen year-over-year. Forward markets suggest miners expect no revenue recovery through 2026, implying continued pressure on marginal operators.
- Retail positioning is dangerously crowded — A 68.7% long / 2.19 long-short ratio on Binance is a classic contrarian sell signal. With 95.9% of liquidations coming from longs in the last 24h ($20.5M), the market is already punishing overleveraged bulls. A break below $63,000 could trigger a cascade.
Key catalysts this week:
- ETF flows — Monday's data will be the first read on whether July 31 was a one-off or the start of a sustained outflow trend.- Fed narrative — Post-FOMC commentary continues; three hawkish dissenters keep the September hike probability elevated (~63%).- Technical breakdown — BTC is testing $63,000 support. A close below $62,500 opens the path to $60,000-$61,000, where the $1.17B put option open interest sits.
Risk factors that could invalidate the bearish view:
- A return to ETF inflows (two consecutive positive days)- A weaker DXY breaking below 98- Surprise dovish commentary from Fed speakers
Key Levels & Watchlist for Tomorrow
- BTC: Watch $63,000 (support) and $64,232 (resistance). Catalyst: Monday ETF flow data (Aug 4) and any Fed speaker commentary. A daily close below $62,500 targets the $60,000-$61,000 zone where the largest put option OI sits ($1.17B). A reclaim of $64,500 would neutralize the short-term bearish structure.
Disclaimer
This is a market briefing, not financial advice. All data is as of the cited sources at the time of writing (August 2-3, 2026). Cryptocurrency markets are highly volatile — do your own research.
 (4)_04bd53b71785326267025.jpg?format=webp&width=48&height=48)
Stay ahead of the market.
Get curated U.S. market news, insights and key dates delivered to your inbox.


AInvest
PRO
AInvest
PRO




Comments
No comments yet