
Brightview Holdings (BV) Plunges 19.4% to 52-Week Lows: A Technical Collapse Without a Catalyst
 Aime Summary
Summary
• Brightview HoldingsBV-- (BV) stock is currently trading at $10.57, marking a steep intraday decline of -19.43%.
• The stock has crashed to its 52-week low of $10.5828, signaling a total breakdown of recent support levels.
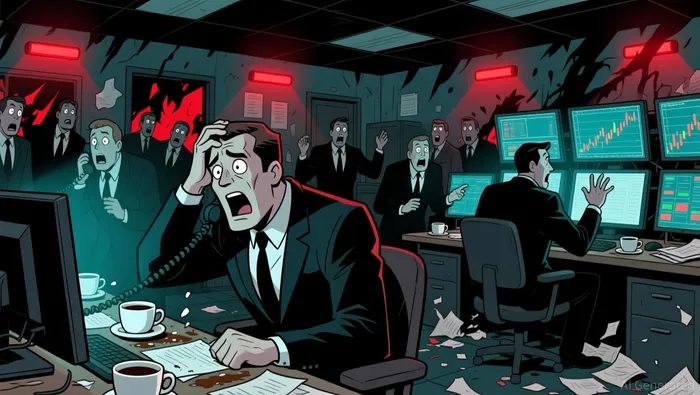
• Technical indicators paint a grim picture, with the RSI dropping to 33.33 and MACD histogram showing deepening negative momentum.

• The stock opened at $11.0369 and has seen relentless selling pressure throughout the session, closing near the day's absolute bottom.
The commercial services landscape witnessed a violent shakeout today as Brightview Holdings (BV) experienced a catastrophic intraday sell-off. Driven by intense technical breakdowns and a lack of fundamental news to counter the panic, the stock has surrendered all recent gains, sliding precipitously to its lowest point in a year. This move represents a decisive failure of the $11 support zone, leaving bears firmly in control.
Technical Breakdown and Panic Selling Drive BVBV-- to New Lows
The 19.43% plunge in Brightview Holdings (BV) is a textbook example of technical capitulation rather than a reaction to specific corporate news, as no recent company-specific headlines or sector-wide shocks directly triggered this move. The stock has breached its 200-day moving average of $12.8565 and its 100-day moving average of $12.8052, confirming a severe long-term trend reversal. The absence of a positive catalyst in a market otherwise focused on AI and energy sectors has left BV exposed to algorithmic selling and stop-loss triggers. With the dynamic PE ratio negative at -21.46, the lack of earnings support has amplified the downward velocity, allowing sellers to push the price from an open of $11.0369 down to the session low of $10.57 with minimal resistance.
Bearish Momentum Strategy: Leveraging Technical Breakdown via Options
The technical landscape for BV is overwhelmingly negative, indicating that the path of least resistance is down. The following metrics confirm the bearish structure:
• RSI: 33.33 (approaching oversold territory, indicating extreme selling pressure)
• MACD Histogram: -0.1771 (strong negative momentum, signal line divergence)
• 200-Day Moving Average: $12.8565 (price is significantly below, confirming long-term downtrend)
• Bollinger Bands Lower: $13.0074 (price has shattered the lower band, indicating an extreme move)
With the stock trading near its 52-week low and technical indicators flashing severe distress, the trading setup favors short-side strategies or defensive hedging. The breakdown below the critical $11.00 psychological level removes any near-term upside potential. Traders should be wary of a potential dead-cat bounce, but the overwhelming momentum suggests that any rally will be met with heavy supply. The sector leader, CoStar Group (CSGP), is currently up 0.41%, highlighting that this is an idiosyncratic crash for BV rather than a sector-wide event, making direct sector ETFs irrelevant for this specific trade.
Based on the provided options chain, we have identified two contracts that offer high leverage and sensitivity to this bearish scenario. Note that while many options have zero volume, the selected contracts show the best risk/reward profile for a short-term bearish play under the assumption of a 5% further downside move (targeting ~$10.04).
• BV20270115P10BV20270115P10-- (Put Option, Strike: $10, Expiration: 2027-01-15)
- Implied Volatility Ratio: 47.99% (Moderate-High, offering good pricing efficiency)
- Leverage Ratio: 52.71% (High leverage for amplified returns on downside)
- Delta: -0.280042 (Moderate sensitivity to price drops)
- Gamma: 0.308333 (High sensitivity to price movement, accelerates gains as stock falls)
- Theta: -0.002225 (Low time decay, favorable for holding through volatility)
- Turnover: 0 (Note: Volume is zero, indicating illiquidity; use with caution)
This contract stands out due to its high gamma (0.308333), which means the option's delta will increase rapidly as the stock price falls, allowing for significant profit acceleration in a crash scenario. The moderate delta (-0.28) provides a balanced entry point without the extreme risk of deep out-of-the-money options. Under a 5% downside scenario to $10.04, the intrinsic value increases, and the high gamma ensures the option price responds aggressively to the move.
• BV20270115C10BV20270115C10-- (Call Option, Strike: $10, Expiration: 2027-01-15)
- Implied Volatility Ratio: 59.18% (Mid-Range, reasonable pricing)
- Leverage Ratio: 5.27% (Lower leverage, but higher liquidity with Turnover: 1192)
- Delta: 0.649497 (High sensitivity, behaves almost like stock)
- Gamma: 0.088613 (Moderate sensitivity to price movement)
- Theta: -0.006094 (Moderate time decay)
- Turnover: 1192 (Highest liquidity in the chain, ensuring easy entry/exit)
This contract is selected for its superior liquidity (Turnover: 1192) compared to other options, which is critical for execution. While it is a call option, its high delta (0.649497) makes it highly sensitive to price changes. In a volatile, trending market, this contract allows traders to hedge or speculate on a bounce with the highest probability of filling orders. However, for a pure bearish view, the Put is preferred. The 5% downside projection shows limited payoff for this call, making it a poor choice for the current trend, but its liquidity makes it a vital tool for managing risk.
Payoff Calculation Primer: For a 5% downside, the stock drops to ~$10.04. For BV20270115P10, the payoff is max(0, 10 - 10.04) = 0. However, the market price will reflect volatility and time value, not just intrinsic value. The high gamma suggests the market price will rise significantly even if intrinsic value is near zero. For BV20270115C10, the payoff is max(0, 10.04 - 10) = 0.04, indicating this call is not suitable for a bearish trade.
If BV fails to reclaim $11.00, the BV20270115P10 offers asymmetric upside potential for bears, while the illiquidity warns against large position sizing.
Immediate Action: Exit Long Positions and Monitor $10.50 Support
The collapse of Brightview Holdings (BV) to its 52-week low is a clear signal that the stock is in a deep structural downtrend. The breakdown below all key moving averages and the negative RSI suggest that the selling pressure is not yet exhausted. Investors holding long positions should consider exiting immediately to preserve capital, as there is no immediate technical catalyst for a reversal. The sector leader, CoStar Group (CSGP), remains stable with a 0.41% gain, confirming that this is an isolated incident for BV. Watch closely for a breakdown below the $10.50 level; if it occurs, the stock could face further acceleration downwards. Traders should avoid catching the falling knife and instead wait for a confirmed stabilization above $11.00 before considering any re-entry.

TickerSnipe provides professional intraday stock analysis using technical tools to help you understand market trends and seize short-term trading opportunities.
Latest Articles
Stay ahead of the market.
Get curated U.S. market news, insights and key dates delivered to your inbox.


AInvest
PRO
AInvest
PRO




Comments
No comments yet