
BP Plunges 3.97%: A Sudden Market Shockwave in the Energy Sector
 Aime Summary
Summary
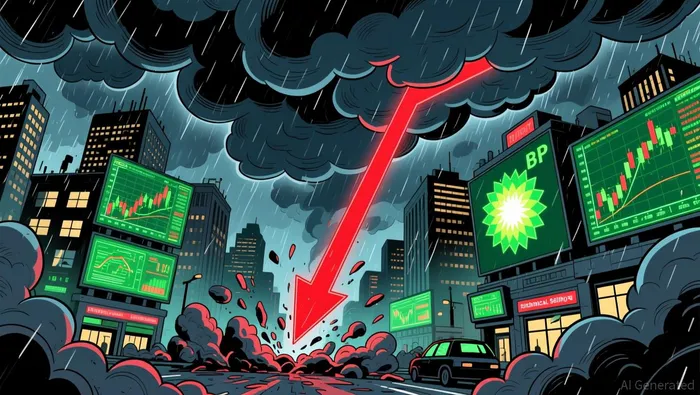
• BPBP-- shares plummet 3.97% to $42.505, shedding nearly $1.75 from the previous close of $44.26

• Intraday trading volume surges to 10,509,246 shares, signaling intense institutional participation and rapid position adjustments
• The stock tests a critical intraday low of $42.19 before attempting a modest recovery, reflecting heavy selling pressure throughout the session
• Despite the sharp decline, BP maintains a robust dynamic PE ratio of 7.24, suggesting underlying valuation resilience amid the volatility
The energy giant is facing a significant intraday correction, driven by a confluence of technical selling and broader market sentiment shifts. The stock opened at $43.235, immediately failing to hold the $43.50 level, and proceeded to carve out a wide trading range between $42.19 and $43.31. This aggressive move down tests the integrity of recent support levels, forcing traders to reassess the short-term momentum.
Technical Breaktest-component
code="BP"
id="strategy_001"
range="3">
down Triggers Intraday Sell-Off
The 3.97% decline is primarily a technical correction rather than a response to specific company-level news, as no major corporate announcements were released during the session. The stock has broken below its 100-day moving average of $43.39, a key psychological and technical barrier that had been holding the uptrend together. This breach has triggered algorithmic selling and stop-loss orders, accelerating the downward momentum. Furthermore, the Relative Strength Index (RSI) at 64.39, while not yet in oversold territory, indicates that the stock was previously overextended, making it vulnerable to a pullback. The lack of buying interest at the open suggests that institutional investors are taking profits after a period of consolidation, leading to a liquidity-driven drop.
Oil & Gas Sector Faces Mixed Sentiment Amid Policy Debates
The broader Oil, Gas & Consumable Fuels sector is currently navigating a complex landscape of policy debates and global supply dynamics. While sector leader ExxonMobil (XOM) has shown relative stability with only a -0.73% intraday decline, BP’s performance significantly underperforms the sector average. Recent sector news highlights divergent regional narratives: in Namibia, former Minister of Mines and Energy Tom Alweendo is urging local financial institutions to deepen their involvement in the oil and gas value chain to prevent foreign capture of advisory fees and project structuring. Simultaneously, in India, Tehseen Poonawalla of Team Bharat has engaged with Ministry officials to discuss petrol pricing and availability, signaling ongoing regulatory scrutiny in key emerging markets. Meanwhile, AnalytiChem has introduced new CONOSTAN GC standards for fuel testing, emphasizing the industry's focus on quality control and regulatory compliance. Despite these positive structural developments, BP’s sharp drop suggests it is decoupling from sector tailwinds, likely due to specific technical overhangs rather than fundamental sector weakness.
Defensive Hedging and Volatility Play: Options Strategy for BP
Traders should adopt a cautious approach as BP tests critical support levels. The technical landscape is mixed: short-term momentum is bearish, but the long-term trend remains bullish. Key technical indicators are as follows:
• 100-Day Moving Average: $43.39 (Resistance) – Price has broken below this key level, turning it into immediate resistance.
• 200-Day Moving Average: $39.82 (Support) – The next major defense line for bulls.
• RSI: 64.39 (Neutral-Bullish) – No longer overbought, but momentum has stalled.
• Bollinger Bands: Upper $45.89, Middle $41.95, Lower $38.01 – Price is approaching the middle band, indicating a potential reversion to mean.
Given the breakdown below the 100-day MA, the immediate outlook is bearish with a target near the 200-day MA. However, the high turnover in options suggests significant hedging activity. We identify two high-potential options contracts based on high gamma, substantial theta decay, and strong liquidity:
• BP20260814P42BP20260814P42-- (Put Option): Strike $42, Expiration 2026-08-14. IV: 36.07%, Leverage: 50.54%, Delta: -0.42, Theta: -0.039, Gamma: 0.147, Turnover: $5,096. This contract offers high gamma sensitivity for rapid price moves and strong liquidity for easy entry/exit.
• BP20260814C42.5BP20260814C42.5-- (Call Option): Strike $42.5, Expiration 2026-08-14. IV: 29.29%, Leverage: 50.54%, Delta: 0.50, Theta: -0.041, Gamma: 0.185, Turnover: $2,018. This contract provides balanced exposure with high gamma, ideal for a potential bounce.
BP20260814P42 stands out due to its high turnover and gamma, making it ideal for traders betting on a further dip to the $41 level. BP20260814C42.5 offers a compelling risk-reward for a short-term rebound, with its delta near 0.50 providing significant leverage.
Options Payoff Calculation Primer: For this payoff estimation, we assume a 5% downside scenario from current price (42.505) where for Call Option Payoff = max(0, ST - K) where ST is projected price and K is strike price and Put Option Payoff = max(0, K - ST) where ST is projected price and K is strike price.This projection helps evaluate option contracts' potential returns under a bearish move scenario. Under a 5% drop to ~$40.38, the P42 contract would have an intrinsic value of $1.62, while the C42.5 contract would expire worthless.
If $42 breaks decisively, BP20260814P42 offers immediate short-side potential with high leverage.
Hold Cash, Watch $42 Breakdown for Entry Signals
The current move is likely a technical correction rather than a fundamental shift, but the breakdown below the 100-day moving average is a warning sign. Investors should wait for stabilization near the $41.95 Bollinger Band middle or the $39.82 200-day MA before committing new capital. The sector leader, ExxonMobil (XOM), has held up better with only a -0.73% decline, highlighting BP’s relative weakness. Watch for a sustained close below $42 to confirm further downside or a recovery above $43.40 to signal a bullish reversal.

TickerSnipe provides professional intraday stock analysis using technical tools to help you understand market trends and seize short-term trading opportunities.
Latest Articles
Stay ahead of the market.
Get curated U.S. market news, insights and key dates delivered to your inbox.


AInvest
PRO
AInvest
PRO




Comments
No comments yet