
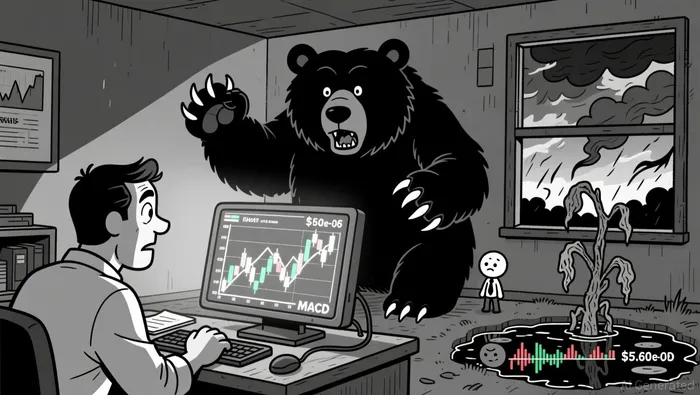
BONK Hits Key Support as Volatility Surges Near $5.60e-06
Summary
• Price action shows key support tested at $5.60e-06 after a bearish engulfing pattern.
• Momentum declines with RSI approaching oversold levels, hinting at potential bounce.
• Volatility increases in late hours, with volume surging near $5.60e-06 level.
Market Overview
The Bonk/Tether (BONKUSDT) pair opened at $5.73e-06 on 2026-03-07 at 12:00 ET, reaching a high of $5.77e-06 and a low of $5.58e-06, before closing at $5.65e-06 on 2026-03-08 at 12:00 ET. Total volume for the 24-hour window was 207,316,400,488.5, with a notional turnover of $117,854.52.
Structure and Candlestick Patterns
Price action displayed a bearish engulfing pattern as the asset fell below $5.73e-06 in the late afternoon, indicating bearish momentum. A doji formed around $5.60e-06 in the early morning, suggesting indecision and potential support. Key support levels appear to be forming between $5.60e-06 and $5.58e-06, with resistance at $5.73e-06.
Moving Averages and Momentum
The 20-period and 50-period moving averages on the 5-minute chart indicate a bearish bias, with price remaining below both lines. RSI dropped to 30–35 in the early hours of 2026-03-08, suggesting the market may be approaching oversold territory. MACD showed a bearish crossover earlier in the session but has since flattened, signaling waning bearish pressure.
Volatility and Bollinger Bands
Bollinger Bands widened as the price dropped below the lower band in the late afternoon, indicating a period of high volatility. However, as price stabilized around $5.60e-06, the bands began to contract slightly, suggesting potential consolidation before a potential breakout.
Volume and Turnover Analysis
Volume spiked significantly in the late afternoon and early evening, particularly between $5.73e-06 and $5.60e-06. Turnover also increased as the asset approached key support levels, suggesting increased participation. Divergence between price and volume is evident during late-night trading, indicating possible buying interest at lower levels.
Fibonacci Retracements
The most recent swing from $5.77e-06 to $5.58e-06 shows retracement levels at 38.2% (~$5.69e-06) and 61.8% (~$5.65e-06). The 61.8% level appears to have offered some initial support, suggesting it could be a key area to watch for further directional bias.
While the 24-hour session was bearish, signs of stabilization and buying interest at key levels could suggest a potential reversal or consolidation phase. Investors should monitor the $5.60e-06 support level for potential breakouts or bounces, and be cautious of increased volatility in the next 24 hours if the market fails to retest recent resistance.
Decoding market patterns and unlocking profitable trading strategies in the crypto space
Latest Articles
Stay ahead of the market.
Get curated U.S. market news, insights and key dates delivered to your inbox.


AInvest
PRO
AInvest
PRO
Comments
No comments yet