
BNB Hits Resistance: Why Volume Spikes Failed to Break Out
 Aime Summary
Summary
- BNB/Tether trades in a tight range, testing resistance near 594.8.
- Volume surged significantly at 08:00 and 10:00 Eastern time.
- Bullish engulfing candles suggest temporary buyer interest at support.
- Price remains closer to resistance levels than support zones.
- Market phase appears range-bound with mean reversion characteristics.
Range-Bound Consolidation
BNB/Tether (BNBUSDT) closed the 12:00 hour at 593.0, with a high of 594.8 and low of 588.0 during the final reporting period. The 24-hour total volume was approximately 1,400 units, with a turnover roughly equivalent to the volume value in USD.
1-Hour Support/Resistance and Candlestick Patterns
The market structure is currently defined as range bound, with price action confined between clear boundaries. The nearest significant resistance is observed at 594.8, where the price rejected during the 10:00 hour candle. Another rejection occurred earlier at 593.7 during the 13:00 hour on the previous day. On the support side, the price found a floor at 588.0 during the 06:00 hour and again at 588.3 during the 05:00 hour. These multiple rejections at 588.0 establish a strong immediate support level. The current price of 593.0 is significantly closer to the resistance at 594.8 than to the support at 588.0, indicating a slight bias toward the upper end of the range. Candlestick analysis reveals a bullish engulfing pattern at 00:00, where the body fully covered the prior candle, followed by a long lower shadow rejection at 03:00. A doji with a long lower shadow appeared at 08:00, suggesting indecision but potential buying pressure. Another bullish engulfing pattern formed at 10:00, supporting the recent move toward resistance. These patterns suggest that buyers are active at lower levels, but sellers are defending the upper resistance zone.
Volume and Turnover vs. Historical Comparison
The 24-hour total volume is approximately 1,400 units. This is below the 15-day average daily volume of 1,844.85 and the 7-day average daily volume of 2,227.34. The 7-day average single-hour volume is 92.81 units. Volume spikes occurred at 08:00 with 290.80 units and at 10:00 with 164.04 units, both exceeding 2× the 7-day average single-hour volume. The spike at 08:00 was followed by a modest price increase of 0.22% over the next 3 hours. The spike at 10:00 was accompanied by a significant price jump of 0.64% in the next 3 hours, reaching the high of 594.8. However, the volume at 10:00 did not sustain higher prices, as the next hour saw a slight pullback to 593.2. This suggests that while volume anomalies drove short-term price movements, they did not result in a sustained breakout. The high volume with no follow-through at 10:00 indicates potential selling pressure at resistance.
Look Back: Current Market Phase
The 7-day price change is 3.42%, and the 3-day change is 1.68%. The 15-day daily price range is 39.9 units. Given the relatively small percentage changes over the week and the defined price range, the market is not in a strong uptrend or downtrend. The structure exhibits lower highs and lower lows over longer periods but has stabilized recently. This behavior is consistent with a sideways or range-bound phase. The price is oscillating within a defined channel, suggesting a mean reversion environment rather than a directional trend. The market appears to be consolidating after previous moves, with no clear evidence of a breakout or breakdown in the immediate short term.
The market is likely to continue ranging between 588.0 and 594.8 over the next 24 hours. An upside break above 594.8 could signal a move toward 596.0, while a downside break below 588.0 may trigger a decline toward 585.7.
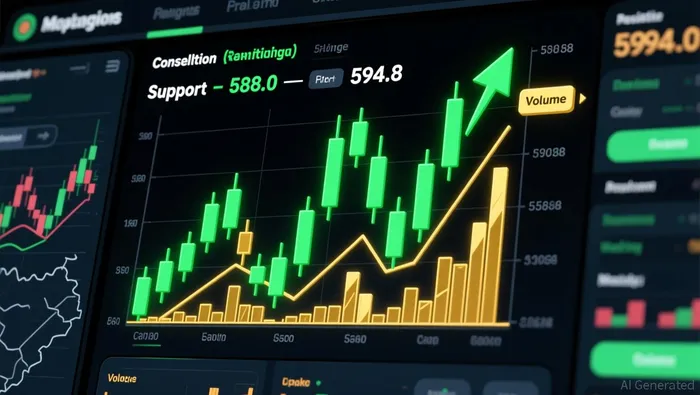

Decoding market patterns and unlocking profitable trading strategies in the crypto space
Latest Articles
Stay ahead of the market.
Get curated U.S. market news, insights and key dates delivered to your inbox.


AInvest
PRO
AInvest
PRO




Comments
No comments yet