
BNB Consolidates Near 593 as Buyers Hesitate
 Aime Summary
Summary
- BNBUSDT trades in a tight range near 590, showing consolidation after recent gains.
- Volume remains below average, indicating low conviction and indecision among market participants.
- Price faces immediate resistance near 593.5, with support holding around 588.0.
- Candlestick patterns suggest buyer hesitation and potential rejection at current highs.
- Market appears neutral, awaiting significant volume to confirm direction for the next session.
Consolidation Near Resistance
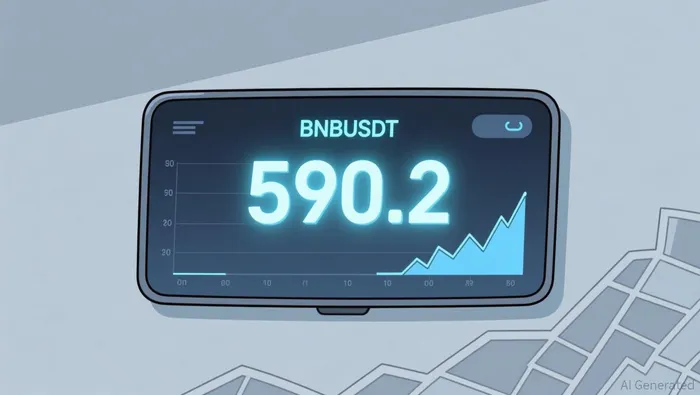
BNBUSDT closed the 24-hour period at 590.2, trading within a narrow band between 585.3 and 593.5. Total 24-hour volume was approximately 840 units, significantly lower than the 7-day hourly average of 93.01 units scaled for comparison, suggesting subdued activity. Turnover reflects this lack of aggressive participation, with price action characterized by small-bodied candles and long wicks indicating indecision.
1-Hour Support/Resistance and Candlestick Patterns
Price action reveals a clear congestion zone where buyers struggle to maintain momentum above 593.5. The hour ending at 11:00 UTC on 2026-08-03 showed a high of 593.5 but closed lower, marking the first rejection. A subsequent hour at 12:00 UTC formed a doji with a long upper shadow, confirming that wicks exceeded twice the body length, a classic sign of selling pressure. The price is currently closer to the immediate support at 588.0 than the strong resistance cluster near 593.5. The hour ending at 00:00 UTC on 2026-08-04 displayed a bullish engulfing pattern, suggesting a temporary pause in selling, but this was followed by hours with long lower shadows at 03:00 UTC, indicating that dips are being bought but rallies are rejected. The market structure remains range-bound, with price hovering in the middle of the recent 15-day range of 39.9 points, specifically near the 590 level, which acts as a pivot between the support cluster around 588.0 and resistance at 593.5.
Volume and Turnover vs. Historical Comparison
The 24-hour total volume of roughly 840 units is notably lower than the 15-day average daily volume of 1820.45 units, indicating a lack of institutional or large-scale participation. When examining hourly data, no single hour exceeded 2× the 7-day average single-hour volume of 93.01 units, meaning there were no significant volume spikes during this window. The highest hourly volume recorded was 162.14 units at 09:00 UTC on 2026-08-03, which coincided with a price increase, but this was not followed by sustained momentum. In the hours following this peak, price action became choppy with no clear directional follow-through. The absence of high-volume breakouts suggests that current price movements are likely driven by retail activity or low-liquidity conditions rather than strong fundamental shifts. Consequently, volume anomalies did not effectively drive price, reinforcing the view that the market is in a low-volatility, low-conviction phase.
Look Back: Current Market Phase
Over the past 15 days, BNBUSDTBNB-- has exhibited a range-bound market structure, characterized by a price range of 39.9 points. The 7-day price change is positive at 2.93%, and the 3-day change is 1.20%, but these gains have stalled within a tight corridor. The market does not show clear lower highs and lows indicative of a downtrend, nor does it display sustained higher highs and lows for a strong uptrend. Instead, the price oscillates between defined support and resistance levels, suggesting a consolidation phase. This sideways movement implies that the market is absorbing recent gains and waiting for a catalyst to break the established range. The current price action aligns with a mean-reversion tendency within a defined channel, rather than a trend-following environment.
Looking ahead, BNBUSDT appears likely to continue consolidating between 588.0 and 593.5 unless volume increases significantly. An upside break above 593.5 could signal a resumption of the short-term uptrend, while a drop below 588.0 may expose the asset to further downside toward 585.3. Traders should monitor volume for confirmation of any breakout or breakdown.

Decoding market patterns and unlocking profitable trading strategies in the crypto space
Latest Articles
Stay ahead of the market.
Get curated U.S. market news, insights and key dates delivered to your inbox.


AInvest
PRO
AInvest
PRO




Comments
No comments yet