
BLUR Volume Spikes Fail to Break Resistance
 Aime Summary
Summary
- BLURUSDT trades near 0.0135 USDT with declining volume.
- Key support at 0.01329 USDT faces immediate testing.
- Volume spikes failed to sustain upward price momentum.
- Market structure shows lower highs and lower lows.
- Downside risk dominates; upside requires volume confirmation.
Market Overview: Downward Pressure
The BLUR/Tether (BLURUSDT) pair closed the latest hour at 0.01356 USDT, following a 24-hour session characterized by low volatility and suppressed turnover. Total volume remained well below historical averages, indicating weak participant engagement.
1-Hour Support/Resistance and Candlestick Patterns
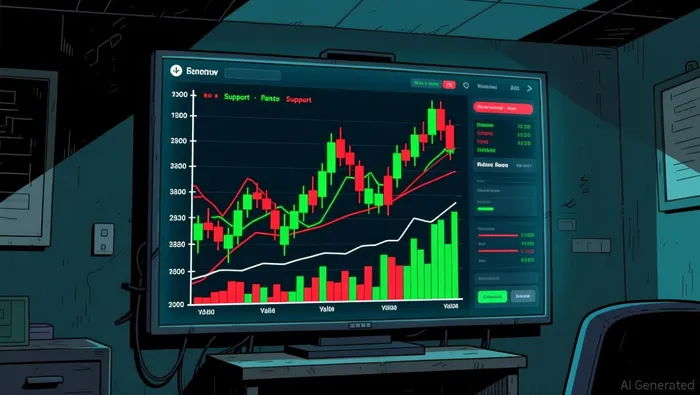
Price action over the last 24 hours has been confined within a narrow band between 0.01329 and 0.01373 USDT. The level at 0.01373 USDT acted as immediate resistance, with price rejecting this ceiling multiple times during the early hours of August 3rd and again on August 4th. Conversely, the 0.01329 USDT level served as a critical support floor, holding firm during the significant sell-off around 20:00 UTC on August 3rd. Candlestick analysis reveals a bearish engulfing pattern at 18:00 UTC on August 3rd, which preceded the decline to the session lows. This was followed by a bullish engulfing pattern at 21:00 UTC, signaling a temporary rebound that failed to break above the 0.01373 USDT resistance. Additionally, doji candles with long lower shadows appeared at 06:00 and 11:00 UTC on August 3rd, suggesting indecision and failed attempts by buyers to push prices higher. The current price of 0.01356 USDT sits closer to the 0.01329 USDT support level than the 0.01373 USDT resistance, indicating that sellers currently hold the upper hand in this micro-structure.
Volume and Turnover vs. Historical Comparison
The 24-hour total volume for BLURUSDTBLUR-- is approximately 1.3 million USDT, which is significantly lower than the 7-day average daily volume of 868,973 USDT and the 15-day average of 2.2 million USDT. This disparity suggests that the current trading activity is not representative of typical daily turnover. Specific hourly volume spikes occurred at 19:00 UTC on August 3rd with 337,715 USDT, 20:00 UTC with 103,359 USDT, and 21:00 UTC with 299,628 USDT. These volumes are substantially higher than the 7-day average single-hour volume of 36,207 USDT. However, the price movement following these spikes did not show strong follow-through. The spike at 19:00 UTC was accompanied by a price drop, while the subsequent spikes at 20:00 and 21:00 UTC resulted in a sharp V-shaped recovery that quickly stalled. The high volume at 02:00 UTC on August 4th with 120,939 USDT was accompanied by a slight price decline, indicating that selling pressure absorbed the liquidity. These anomalies suggest that volume spikes did not effectively drive sustainable price trends, but rather facilitated short-term volatility within a constrained range.
Look Back: Current Market Phase
The 7-day price change of -4.64% and the 3-day change of -2.09% indicate a moderate downward trend. The market structure feature is identified as lower lows, which is a hallmark of a downtrend. Over the past 15 days, the asset has experienced significant volatility, including a sharp drop in late July, but has failed to establish a base of higher highs. The current price action is consolidating at lower levels, suggesting that the market is in a corrective phase within a broader downtrend. The lack of strong bullish momentum and the presence of lower highs confirm that the market is not in a sideways or uptrend phase. Instead, it appears to be in a mean reversion phase following the larger prior moves, but with a clear bias towards downside until support levels are decisively broken.
The BLURUSDT pair may continue to test the 0.01329 USDT support level in the next 24 hours. A break below this level could trigger further downside risk, while a sustained move above 0.01373 USDT would be required to suggest a potential reversal.

Decoding market patterns and unlocking profitable trading strategies in the crypto space
Latest Articles
Stay ahead of the market.
Get curated U.S. market news, insights and key dates delivered to your inbox.


AInvest
PRO
AInvest
PRO




Comments
No comments yet