
Blue Owl (OWL) Surges 5.03% on Golden Cross and Bullish MACD as Price Breaks Above Key Averages
Blue OwlOWL-- (OWL) surged 5.03% in the most recent session, closing at $15.66, a level that aligns with a potential breakout above the 50-day moving average (~$15.50) and 200-day moving average (~$15.00). This suggests short-term bullish momentum, with the 50-day MA crossing above the 200-day MA to form a golden cross, reinforcing the uptrend. The 100-day MA (~$15.30) acts as a dynamic support, and price action remains above all three, indicating structural strength.
Candlestick Theory
The recent price action forms a strong bullish candle with a long upper wick, suggesting buyers retook control after a prior consolidation phase. Key support levels are identified at $14.91 (previous close) and $14.45 (a prior swing low), while resistance is near $15.66 (current close) and $15.80 (a former high). 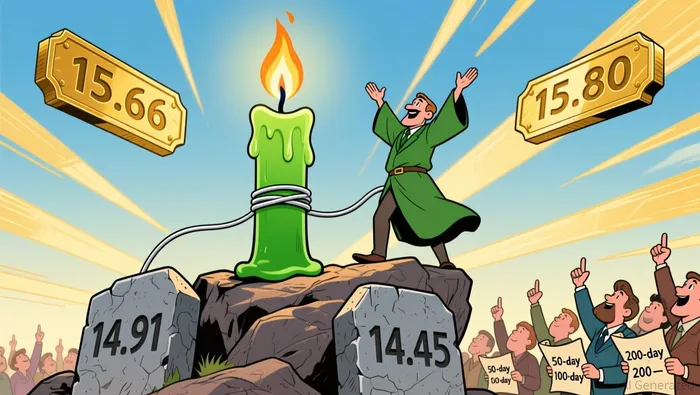 A potential three-white-soldiers pattern may emerge if the next session closes above $15.80, signaling further upside. However, a rejection below $14.91 could trigger a retest of the $14.45 level, where prior buying interest was observed.
Moving Average Theory
The 50-day MA (~$15.50) and 100-day MA (~$15.30) are both rising, while the 200-day MA (~$15.00) acts as a long-term floor. The price’s position above all three averages confirms a multi-timeframe bullish bias. A sustained close above the 50-day MA would likely extend the trend, whereas a breakdown below the 100-day MA (~$15.30) could signal weakening momentum.
MACD & KDJ Indicators
The MACD histogram is positive and expanding, with the MACD line above the signal line, reinforcing upward momentum. The KDJ stochastic oscillator shows %K (~80) and %D (~75) in overbought territory, suggesting a potential pullback. However, the alignment of MACD strength with the bullish price action increases the probability of a continuation. Divergence between %K and price action (e.g., lower highs in %K vs. higher highs in price) may warn of a near-term reversal, though this remains speculative without a clear bearish signal.
Bollinger Bands
The price is currently near the upper Bollinger Band (~$15.80), indicating high volatility. The bands have widened significantly from a prior contraction in early December, suggesting a breakout phase. A close above the upper band may trigger further expansion, but a pullback to the mid-band (~$15.25) could test intraday volatility. The lower band (~$14.70) remains a critical support level, with a breach likely to signal a trend reversal.
Volume-Price Relationship
Trading volume spiked to $239.86 million in the latest session, validating the 5.03% rally. This aligns with the price’s breakout above key resistance, suggesting strong conviction. However, declining volume on follow-through rallies could indicate waning momentum. A divergence between volume and price (e.g., lower volume on higher closes) may foreshadow a correction.
Relative Strength Index (RSI)
The 14-day RSI is ~68, approaching overbought territory (70), indicating caution. While this does not immediately signal a reversal, a close above 70 would heighten the risk of a pullback. Historical context shows RSI often retraces to the 50–60 range after overbought levels, suggesting a potential correction to $15.00–$15.30. However, the RSI’s alignment with the bullish MA and MACD trends suggests the rally may persist for at least another week.
Fibonacci Retracement
Key Fibonacci levels from the December 2025 low ($13.49) to the recent high ($16.16) include 50% at $14.83 and 61.8% at $15.31. The current price (~$15.66) is above the 50% retracement, suggesting buyers are maintaining control. A retest of the 61.8% level ($15.31) could trigger further buying, while a breakdown below 50% would invalidate the bullish case.
The analysis highlights a confluence of bullish signals from moving averages, MACD, and volume, with the RSI and KDJ indicators cautioning against overextension. Divergences between the KDJ stochastic and price action may precede a correction, but the broader technical setup favors a continuation of the uptrend toward $15.80–$16.00, with tight stops below $14.91 to manage risk.
If I have seen further, it is by standing on the shoulders of giants.
Latest Articles
Stay ahead of the market.
Get curated U.S. market news, insights and key dates delivered to your inbox.
AInvest
PRO
AInvest
PRO
Comments
No comments yet