
How the BLS's New Inflation Metrics Are Reshaping Investment Strategies in a Post-QE World


The U.S. Bureau of Labor Statistics (BLS) has long been the gold standard for inflation data, but its recent methodological updates and the release of specialized research indices are quietly reshaping how investors interpret inflation and allocate assets. While the term "XRPI" has gained traction in some market circles, it is not an official BLS metric. Instead, the BLS has been refining tools like the Research CPI by Equivalized Income Quintiles (R-CPI-I) and Research Chained CPI by Equivalized Income Quintiles (R-C-CPI-I), which offer granular insights into inflation across income groups. These indices, though experimental, are now influencing asset allocation strategies in a post-quantitative easing (QE) era where traditional inflation metrics are increasingly seen as insufficient.
The BLS's Shift to Income-Based Inflation Analysis
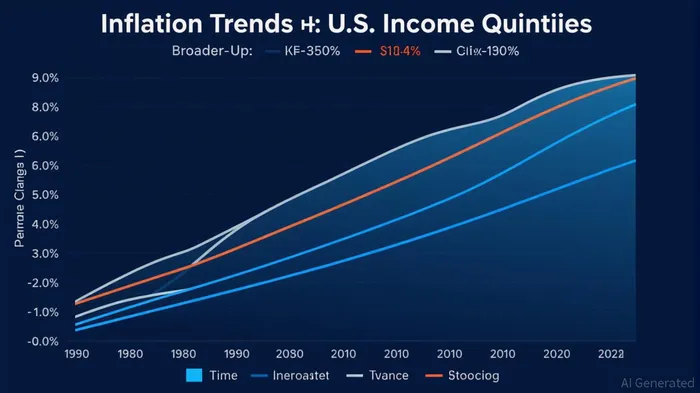
The R-CPI-I and R-C-CPI-I divide the population into five income quintiles, adjusting for household size to create a more equitable comparison of living costs. By smoothing expenditure weights from the Consumer Expenditure (CE) survey, the BLS mitigates sampling errors and provides a clearer picture of how inflation varies for different economic groups. For example, lower-income households may face higher inflation in essentials like food and energy, while higher-income groups might see slower price growth in discretionary spending. This divergence challenges the one-size-fits-all narrative of the CPI-U and C-CPI-U, which average inflation across all urban consumers.
The BLS's July 2025 announcement of methodological updates—such as replacing survey data with secondary sources for wireless telephone services and leased vehicles—further underscores its commitment to modernizing inflation measurement. These changes aim to capture rapidly evolving consumption patterns, particularly in tech-driven sectors. While not directly tied to XRPIXRPI--, these updates highlight the BLS's broader effort to refine its tools, which indirectly supports the case for income-based inflation analysis.
Implications for Inflation Expectations and Asset Allocation
In a post-QE world, where central banks are less likely to flood markets with liquidity, investors must grapple with heterogeneous inflation trends. The R-CPI-I and R-C-CPI-I reveal that inflation is not uniform: for instance, the bottom quintile might experience a 6% annual inflation rate, while the top quintile sees just 2%. This disparity has profound implications for asset classes.
- Consumer Staples vs. Discretionary Sectors:
- Consumer staples (e.g., food, utilities) may outperform if lower-income groups face persistently higher inflation. These sectors are often seen as defensive, but the R-CPI-I suggests they could become growth drivers in a polarized inflation environment.
Discretionary sectors (e.g., luxury goods, travel) might underperform if higher-income groups experience slower price growth. Investors should monitor R-CPI-I data for clues about demand shifts.
Real Estate and Housing:
The BLS's R-COICOP index, aligned with OECD standards, highlights how housing costs vary across income groups. For lower-income households, where housing often constitutes a larger share of spending, rising rents could drive demand for real estate investment trusts (REITs) or inflation-linked bonds.Technology and Innovation:
The BLS's shift to using transaction data for leased vehicles and wireless services reflects the growing importance of tech-driven consumption. Sectors like semiconductors and cloud computing could benefit from sustained demand, even as traditional inflation metrics lag.
Strategic Recommendations for Investors
Diversify Across Income-Linked Sectors:
Use the R-CPI-I to identify sectors where inflation is accelerating or decelerating. For example, if the R-CPI-I for the bottom quintile shows rising food inflation, consider overweighting agricultural commodities or grocery retailers.Rebalance Fixed-Income Portfolios:
Inflation-linked bonds (e.g., TIPS) remain a hedge, but the R-C-CPI-I's chained methodology—accounting for substitution effects—can help investors better estimate real returns.Monitor BLS Methodological Updates:
The BLS's July 2025 changes to wireless and leased vehicle indices signal a broader trend toward integrating alternative data. Investors should track these updates, as they may influence sector-specific inflation expectations.Leverage International Comparisons:
The BLS's R-HICP (Harmonized Index of Consumer Prices) allows for cross-border inflation analysis. This is critical for global investors seeking to hedge against currency risks or identify undervalued markets.
Conclusion
While the term "XRPI" may be a misnomer, the BLS's evolving research indices are undeniably reshaping how investors perceive inflation. In a world where monetary policy is no longer the dominant force, understanding the distributional effects of inflation is key. By incorporating the R-CPI-I and related metrics into their analysis, investors can craft more resilient portfolios that account for the nuanced realities of price changes across income groups. As the BLS continues to refine its tools, staying ahead of these shifts will be crucial for navigating the post-QE landscape.
Mezclando la sabiduría tradicional del comercio con las perspectivas de vanguardia en el campo de las criptomonedas.
Latest Articles
Stay ahead of the market.
Get curated U.S. market news, insights and key dates delivered to your inbox.


AInvest
PRO
AInvest
PRO
Comments
No comments yet