
Block Stock Plunges 5.26% to $65.14 Amid Heavy Selling Pressure
Generated by AI AgentAinvest Technical Radar
Friday, Jul 11, 2025 6:30 pm ET2min read
XYZ--
Block (formerly Square) declined 5.26% to $65.14 on July 11, extending losses to 5.61% over two consecutive sessions amid elevated trading volume of 12.7 million shares. This bearish momentum reflects intensified selling pressure as the stock approaches critical technical levels.
Candlestick Theory
Recent sessions show deteriorating price structure. The July 11 candle formed a long upper shadow (high: $68.56, close: $65.14) after testing resistance near the July 10 range, signaling rejection of recovery attempts. This creates a resistance zone at $68.50–$69.00. Support now converges at $64.85 (July 11 low), with a break potentially targeting the psychological $63.00 level last defended on June 26. The absence of hammer or engulfing reversal patterns suggests ongoing bearish dominance.
Moving Average Theory
The 50-day moving average (approx. $63.00) has flattened after crossing below the 100-day MA (approx. $62.50) in late June, signaling neutral-to-bearish intermediate sentiment. The current price ($65.14) has fallen below both averages, reinforcing bearish pressure. Sustained trading under these averages may accelerate selling, while a recovery above $66.50 would be needed to challenge the descending 200-day MA (approx. $67.50).
MACD & KDJ Indicators
MACD shows bearish momentum expansion, with the signal line accelerating below the zero line following negative July 11 divergence. Meanwhile, the KDJ oscillator has entered oversold territory (K: 28, D: 33), but the lack of bullish crossover suggests limited reversal potential. Confluence appears in bearish alignment, though KDJ’s oversold reading may trigger short-term consolidation near $64.50 support.
Bollinger Bands
Volatility expanded sharply on July 11 as price touched the lower band ($64.80), breaking the preceding three weeks’ tight range. Band width expansion historically precedes directional moves—here, the breakdown suggests continuation potential. Acceptance below $65.00 could open a bearish runway toward $62.50.
Volume-Price Relationship
The July 11 sell-off occurred on 127% above-average volume, confirming bearish conviction. Volume spikes accompanied each significant down day since the July 8 high ($70.98), demonstrating distribution. Absent accumulation patterns, this volume profile signals institutional unloading, though climactic volume may foreshadow exhaustion near $64.00.
Relative Strength Index (RSI)
The 14-day RSI (37) remains neutral but is accelerating downward. While not yet oversold (<30), the indicator’s rapid decline aligns with bearish momentum. Previous oversold reversals occurred near RSI 25 during May’s consolidation, suggesting $62.50 as a potential inflection zone if downside momentum persists.
Fibonacci Retracement
The corrective phase from May’s $46.53 low to July’s $70.98 peak shows critical retracement levels: 23.6% ($66.00) was breached decisively on July 11. Next support converges at 38.2% ($63.11), aligning with the June swing low ($62.01). This zone represents a probable bearish target and potential reversal area.
Confluence and Divergence Observations
Notable confluence exists at $63.00–$63.50, where the 38.2% Fibonacci level, 50-day MA, and prior swing lows create a high-impact support cluster. Divergences remain limited, though KDJ’s oversold reading against persistent MACD deterioration warrants monitoring for potential technical rebounds. Probabilistically, indicators align toward continued bearishness below $66.00, with reversal signals requiring confirmation above $67.80 resistance.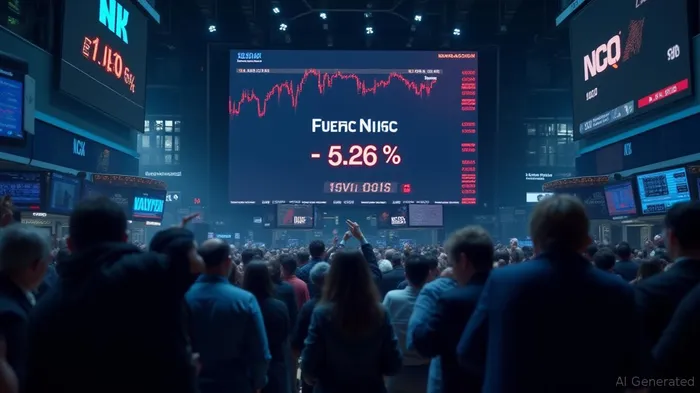
If I have seen further, it is by standing on the shoulders of giants.
Latest Articles
Stay ahead of the market.
Get curated U.S. market news, insights and key dates delivered to your inbox.
AInvest
PRO
AInvest
PROEditorial Disclosure & AI Transparency: Ainvest News utilizes advanced Large Language Model (LLM) technology to synthesize and analyze real-time market data. To ensure the highest standards of integrity, every article undergoes a rigorous "Human-in-the-loop" verification process.
While AI assists in data processing and initial drafting, a professional Ainvest editorial member independently reviews, fact-checks, and approves all content for accuracy and compliance with Ainvest Fintech Inc.’s editorial standards. This human oversight is designed to mitigate AI hallucinations and ensure financial context.
Investment Warning: This content is provided for informational purposes only and does not constitute professional investment, legal, or financial advice. Markets involve inherent risks. Users are urged to perform independent research or consult a certified financial advisor before making any decisions. Ainvest Fintech Inc. disclaims all liability for actions taken based on this information. Found an error?Report an Issue

ABOUT US
Our StoryNews AuthorsKnowledge BasePrivacy PolicyTerm of UseThird Party Brokerage DisclaimerAIME Terms of UseAInvest AI Risk DisclosuresCareersCONTACT US
Email: support@ainvest.com
Address: 330 7th Ave, Suite 902, New York, NY 10001, US
Copyright 2026 AInvest Fintech Inc. All rights reserved.
Comments
No comments yet