

The Slate Is Thin Where It Counts
Friday's earnings slate is thin where it counts, and that is the first thing to understand about the options market's pricing today. Every true mega-cap already reported earlier in the week, and one of them — Walmart — tumbled about 9% on Thursday after its outlook disappointed Wall Street. That leaves the August 21 watch list as a small/mid-cap affair: Ubiquiti, the largest U.S. reporter at around $34.7 billion, reports before the open; KE Holdings, around $19 billion; BJ's WholesaleBJ--, around $12 billion, also before the open; and The Buckle, around $2.2 billion. Small caps, big idiosyncratic vol. And the only clean implied-move figure on the whole slate belongs to BJ'sBJ--.
BJ's Is the Rich-Vs-Cheap Story
The options market is pricing a +/-9.0% move on BJ's report — the at-the-money front-week straddle, a call and a put at the same strike whose combined price is how the market estimates the underlying move for the event. Against BJ's 10-year average actual post-earnings move of +/-9.6%, that implied number is roughly fair. Against what BJ's has actually delivered lately, it is rich — get this — the last four prints were -8.2% (May 22, 2026), -1.5% (March 5, 2026), +1.1% (November 21, 2025) and -8.5% (August 22, 2025), an average absolute reaction of about +/-4.8%. Options are not pricing BJ's recent record. They are pricing the long-run average, roughly twice the size of every move the stock has just made.
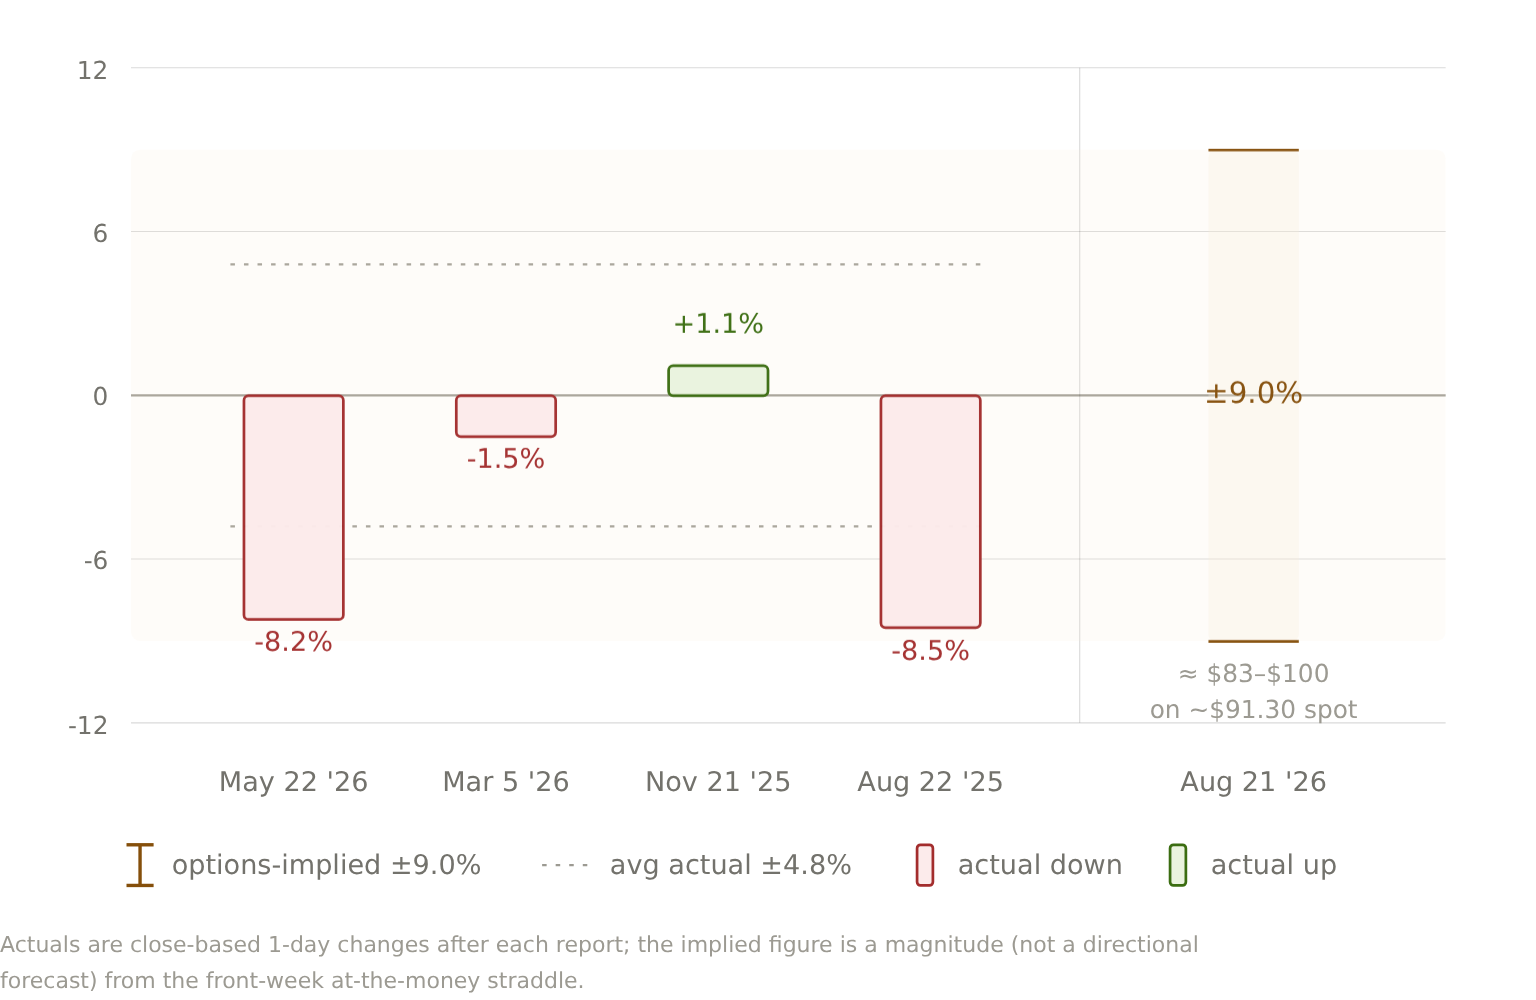
Actuals are close-based 1-day changes after each report; the implied figure is a magnitude (not a directional forecast) from the front-week at-the-money straddle.
| Report | Actual 1-day move | Implied move |
|---|---|---|
| May 22 2026 | -8.2% | n/a |
| Mar 5 2026 | -1.5% | n/a |
| Nov 21 2025 | +1.1% | n/a |
| Aug 22 2025 | -8.5% | n/a |
| Aug 21 2026 (impending) | n/a | +/-9.0% |
In dollar terms it is easy to see how much room the market is giving the stock. +/-9.0% on spot near $91.30 works out to a band of roughly $83.10 to $99.50, about +/-$8.20 either way. I'm flagging those dollar levels as derived — spot times implied percentage, not a separately reported options figure — and spot is moving toward the open. The arithmetic still tells the story: BJ's worst print of the last year, the -8.2% in May, lands around $83.80, just inside the band's lower edge. The -8.5% from August 2025 lands around $83.50, still inside. The market set the range wide enough to swallow the stock's entire recent downside record, which is exactly why today's number looks rich against the recent tape and only fair against a decade.
The IV-Crush Mechanic
This is where the mechanics do the heavy lifting, because the implied-move figure is not a forecast — it is a price. In the sessions before a report, option buyers bid up short-dated premium; the entire expected event move gets concentrated into the at-the-money straddle, which is why average implied volatility runs elevated into the number. As soon as the print hits, the uncertainty is resolved and that embedded earnings vol — the implied volatility that contains the event — deflates almost immediately. That is the IV crush. A straddle buyer only gets paid if the realized move is bigger than the implied move; the seller harvests the volatility-risk premium whenever the realized move lands inside the implied range. Today's edge, such as it is, is the gap between the +/-9.0% the market is charging and the roughly +/-4.8% BJ's has actually averaged over its four most recent prints.
The Rest of the Slate: Thin, Priced for Action
Where listed-options data are available, the slate is priced for something to happen. Per Ainvest data, BJ's average implied volatility runs about 38.4% with put/call volume near 0.99 — balanced, roughly equal buying pressure on calls and puts. KE Holdings, around $17 and up 7.8% for the year, carries the highest average IV of the four at 44.3%, and it is heavily call-side: put/call volume of 0.37 and put/call open interest of 0.34 tell you options traders are leaning long into the number. The Buckle averages 37.4% implied vol while sitting near its 52-week low of around $40.73, down about 20% year to date and -4.9% on the week. Ubiquiti is the biggest name by market cap at roughly $573.87 — a 52-week span from about $505.73 to $1,100, a stock that traded at $1,100 within the last year and now sits near $574 — up 3.7% year to date but down about 25% over the last 120 trading days and -2.8% into the print, after its May 8 report produced a -9.1% one-day drop and a further -31.8% drift over 105 days.
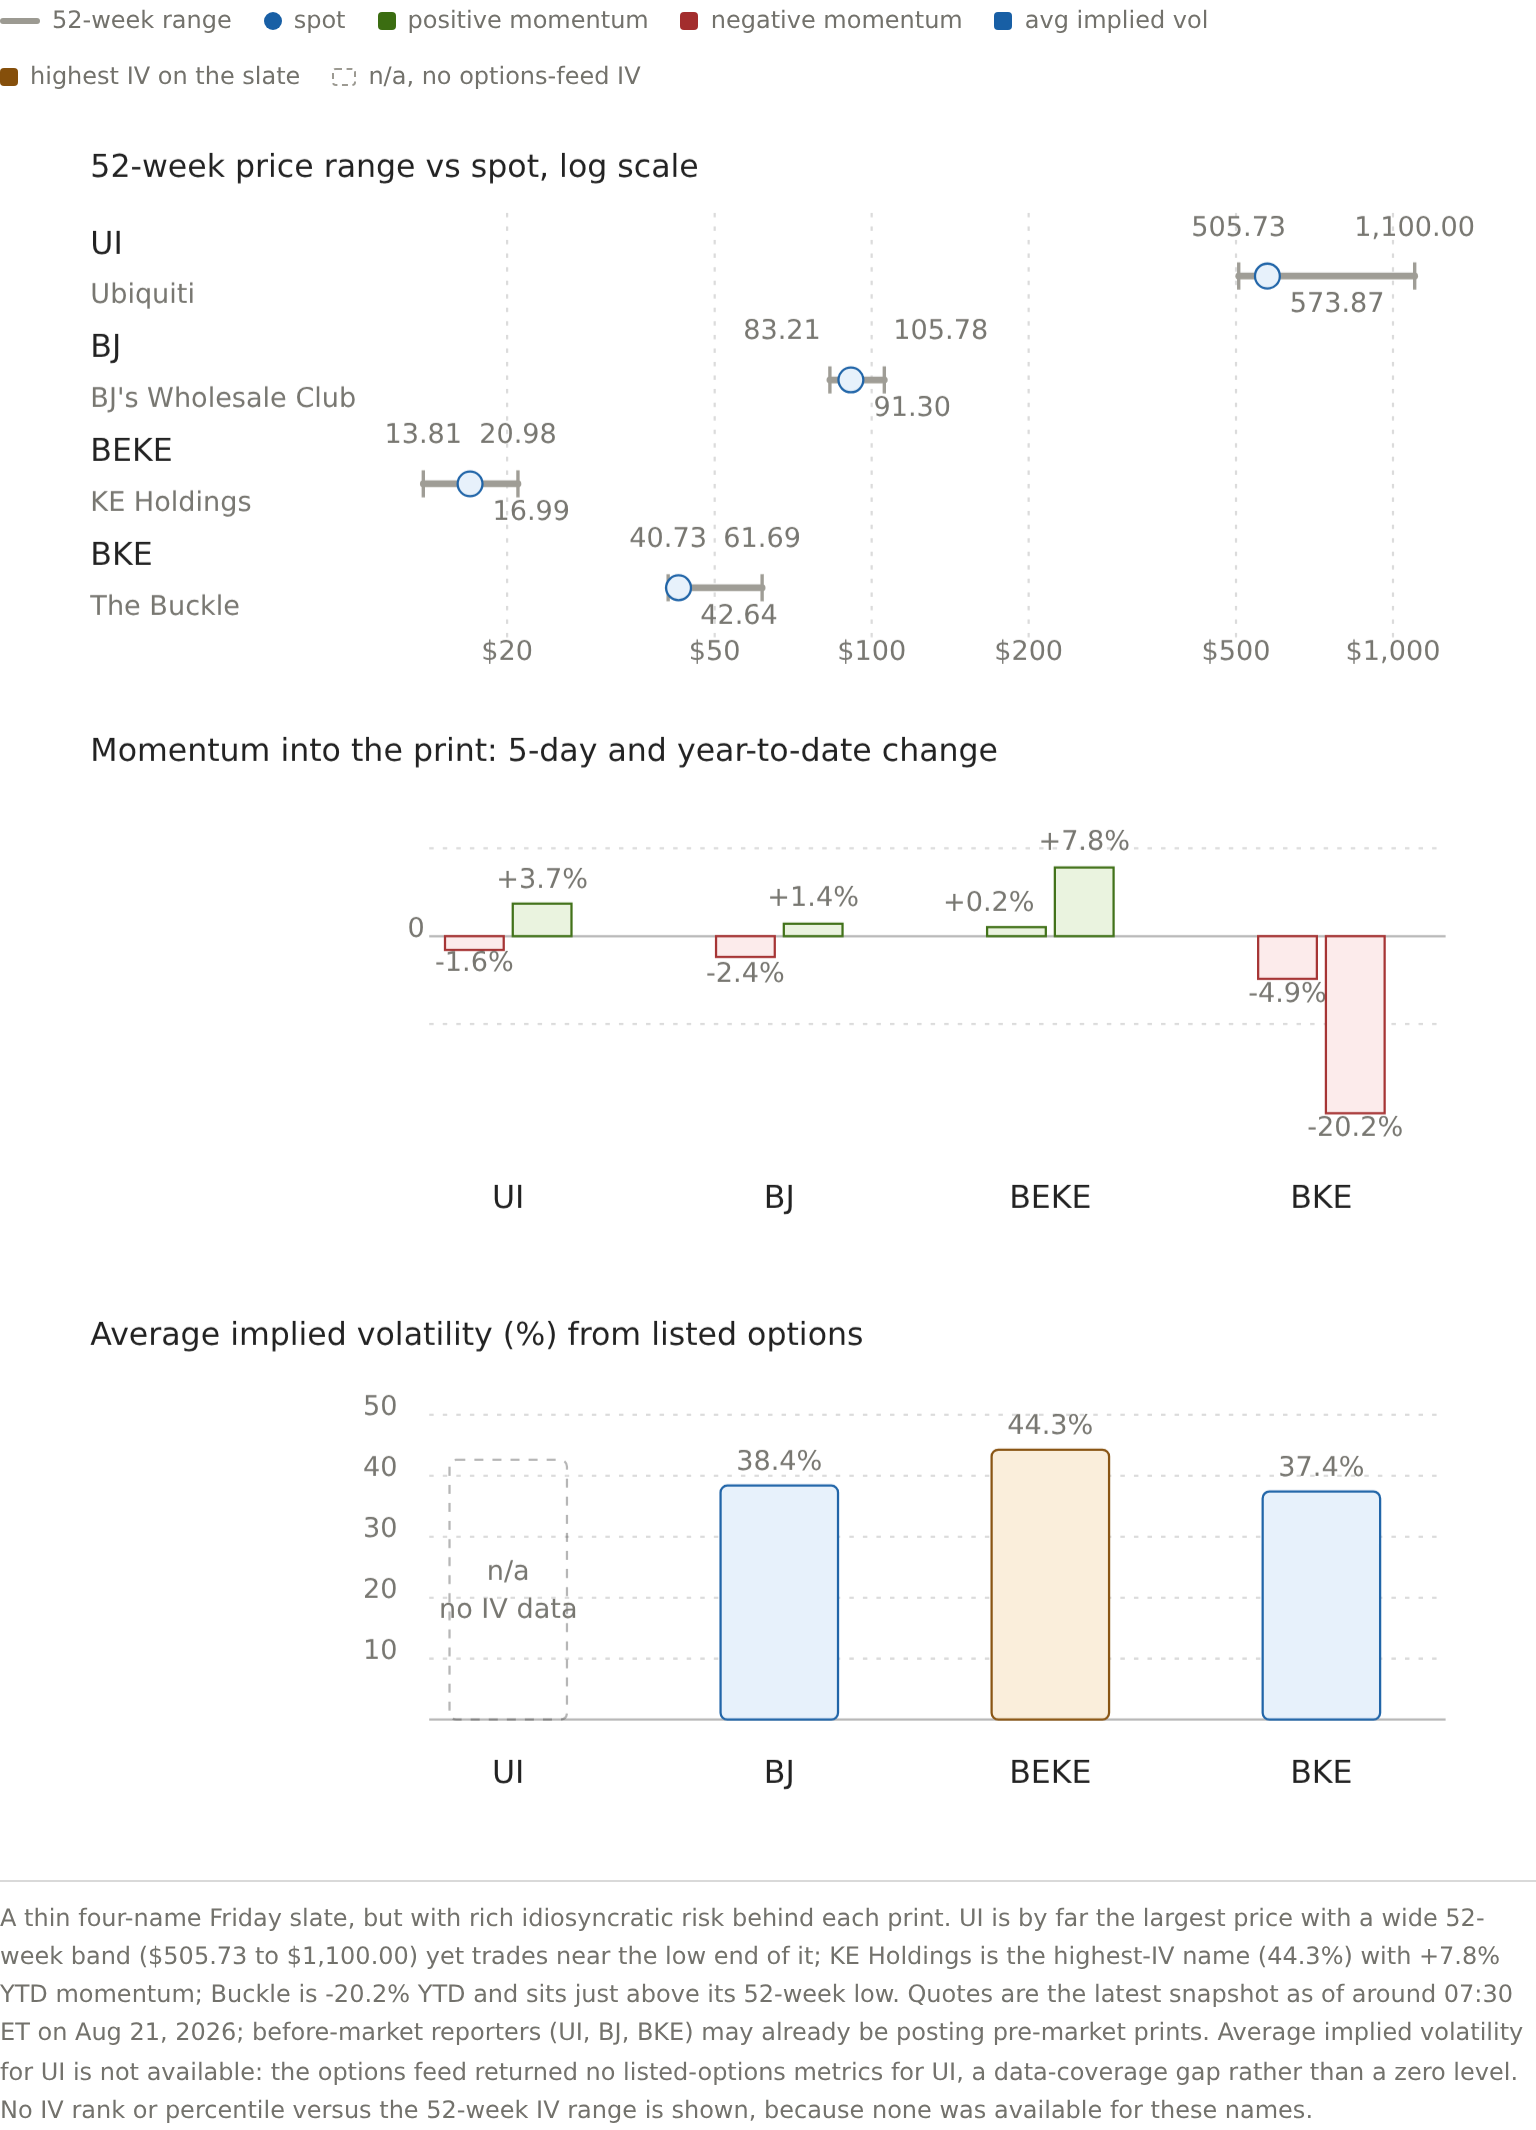
| Ticker | Company | Spot | 5-day | YTD | 52-wk low | 52-wk high | Avg IV |
|---|---|---|---|---|---|---|---|
| UI | Ubiquiti | $573.87 | -1.6% | +3.7% | $505.73 | $1,100.00 | n/a |
| BJ | BJ's Wholesale Club | $91.30 | -2.4% | +1.4% | $83.21 | $105.78 | 38.4% |
| BEKE | KE Holdings | $16.99 | +0.2% | +7.8% | $13.81 | $20.98 | 44.3% |
| BKE | The Buckle | $42.64 | -4.9% | -20.2% | $40.73 | $61.69 | 37.4% |
The price context matters here, because two of these names are reporting into a broken retail tape. Per Ainvest data, BJ's sits near its 50-day average, flat on the year at +1.4% after a -2.4% week. Buckle is down about 20% year to date and near a 52-week low. Walmart's 9% Thursday drop on guidance is a direct read-through for both — same consumer, same pricing-power squeeze — so the options market has permission to price fear into this morning even before the numbers land. The lone call-heavy exception is KE Holdings, the one name where option traders are betting on upside into the print.
The Expiration Twist
There is a structural reason to treat the implied-move math with extra care today, and it is not exotic: August 21 is the monthly expiration, the third Friday of each month for standard U.S. equity and index options. For the before-market reporters — Ubiquiti, BJ's and Buckle — the front-week straddle that prices the earnings event expires at today's close, the same close that captures the morning gap. So the earnings gap and an ordinary one-day expiration window are fused into a single settlement. Around expiration, dealer hedging unwinds and gamma positioning resets, which can pin price toward the strike with the heaviest open interest and amplify the day's move in either direction once it starts moving. The practical consequence: the implied-move figure is a cleaner signal for a multi-day or after-close reporter than it is for a name that reports and expires in the same session. On an event-plus-expiration Friday, the bias is toward realized moves landing inside the implied range.
What to Watch
The watchpoints are mechanical, not emotional. First, the IV crush: the number hits, the embedded volatility deflates, and the straddle's value gets cut whether the stock moved or not — holding premium through a print is paying for resolution, and sellers get paid for that even on a quiet gap. Second, the realized gap versus the implied range: if BJ's closes inside the roughly $83.10 to $99.50 band, the seller banked the risk premium; if it closes outside the band, the buyer finally got paid. Third, sell-the-news: with the expiration window fusing the gap and a one-day settle, a big pre-market open can reverse into the close as dealer hedges unwind. The reference line is $91.30, the middle of the implied band; a gap that holds above it keeps the stock in the range's upper half, and a gap that slides toward $83 turns the close into a gamma-unwind event.
What I Could Not Verify
I want to be straight about the holes before anyone trades off a number I could not produce. The implied earnings moves for Ubiquiti, KE Holdings and Buckle could not be verified from available sources, and I have not stated them — the only clean attested implied figure on today's slate is BJ's +/-9.0%. The options feed returned no listed-options metrics for Ubiquiti even though the company trades listed options; that is a data-coverage limitation, not evidence the options do not exist. KE Holdings' EPS estimate conflicts across calendars — $0.31 from one, $2.12 from another, likely a per-ADS versus per-share scope difference — and I am leaving it unresolved rather than choosing one. Historical actual moves sit on different bases: OptionSlam measures price change relative to the pre-earnings close, while Options AI reports close-to-close one-day moves, so the same August 2025 print shows up as -7.1% on one basis and -8.5% on the other. The snapshots here are as of roughly 07:30 ET, and the before-market reporters may already be printing. And no IV rank or percentile versus the 52-week range was available for any of these names — these are absolute average IV levels, not percentile claims.
The Conditional Read
So here is the way I read the setup. If BJ's prints and does what it has done in four straight quarters — a realized move inside the implied band, most of the risk to the downside — the straddle seller banks the premium and the stock spends the day settling toward one side of that $83.10 to $99.50 range. If the number breaks the tape hard enough to push the realized move outside the band, the buyer finally collects, and on a third-Friday settle that is when the gamma feedback kicks in — the move feeds on itself until the dealers get flat. Given the retail read-through from Walmart and a name with three down prints in its last four, understanding what I understand about how these events settle says the bias is to the seller today. The trigger to watch is whether the realized gap merely reaches the band's edge or genuinely tears through it. Views are my own, and nothing here is investment advice.








Comments
No comments yet