
Bitcoin's Uptober 2025: A Critical Test for Seasonal Momentum and Institutional Confidence


Bitcoin's October 2025 price action has become a focal point for investors, traders, and macro analysts alike. Historically, October has been a volatile month for BitcoinBTC--, marked by sharp corrections (e.g., 2013, 2018) and, occasionally, explosive rallies. This year, the cryptocurrency faces a pivotal test: can it close above its monthly open amid a confluence of technical strength, institutional inflows, and macroeconomic tailwinds? Let's break it down.
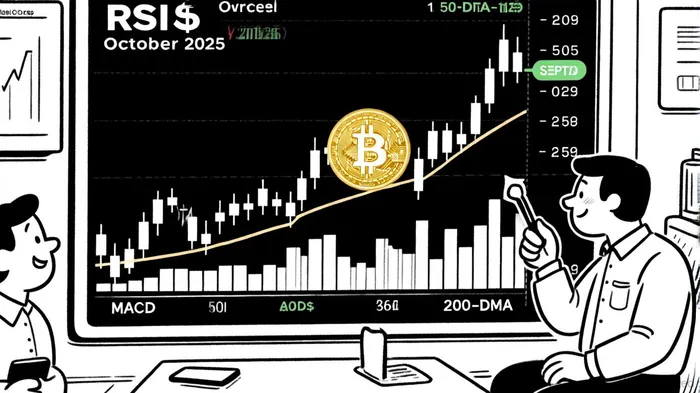
Technical Indicators: A Bullish Setup for Uptober
Bitcoin's technical profile in October 2025 paints a compelling case for a bullish breakout. Key indicators like RSI, MACD, and moving averages align to signal strong momentum.
- RSI and MACD Confirm Bullish Momentum
- The Relative Strength Index (RSI), set to a 30-period sensitivity for 2025 trading, according to a Gate guide, has oscillated between overbought (above 70) and oversold (below 30) levels, reflecting extreme volatility. As of October 24, RSI readings suggest Bitcoin is recovering from a short-term oversold condition, hinting at a potential rebound, per a CryptoDaily analysis.
The MACD, using custom 24/52/9 settings per the Gate guide, has shown a bullish crossover in late October, with the MACD line crossing above the signal line. This, combined with a narrowing histogram, indicates accelerating upward momentum, according to a FinanceFeeds report.
Moving Averages Signal a Golden Cross
- Bitcoin's 200-day moving average (DMA) has acted as a critical support level, currently around $105,000. The 50-DMA crossed above the 200-DMA in mid-October, forming a golden cross-a classic bullish signal, per TradingNews coverage. This confluence of moving averages suggests institutional buying pressure and a shift in market sentiment from bearish to constructive, as noted in a Coinotag report.
Macro-Driven Catalysts: ETF Inflows, Fed Policy, and Trade Tensions
Technical strength alone isn't enough to drive a sustained rally. October 2025 has seen a perfect storm of macroeconomic factors reinforcing Bitcoin's bullish case.
- Bitcoin ETF Inflows Signal Institutional Confidence
- U.S. spot Bitcoin ETFs recorded a record $477.19 million in inflows on October 24, led by BlackRock's IBIT ($210.9M) and ARK's ARKB ($162.85M), according to a Coinotag analysis. This marked the strongest single-day inflow since mid-September and reversed a four-day outflow streak. Cumulative assets under management now stand at $151.58 billion, or 6.9% of Bitcoin's total market cap, the Coinotag analysis added.
Analysts like Geoff Kendrick of Standard Chartered argue that Bitcoin needs $1 billion in weekly inflows to outperform gold, which saw $2B in outflows last week, according to an OilPrice article. The Bitcoin-gold ratio has improved post-October 10's volatility, but gold still leads in prediction markets with a 65% probability of outperformance in 2025, per OilPrice.
Fed Rate Cuts and QT End: A Tailwind for Risk-Assets
- The Federal Reserve's October 29, 2025, meeting delivered a 25-basis-point rate cut, with a 97.8% probability priced in by markets, according to a Decrypt preview. More importantly, the Fed signaled the end of quantitative tightening (QT), a move that could inject liquidity into risk assets like Bitcoin, as covered in a Coinotag piece.
Historically, Bitcoin has thrived in accommodative monetary environments. Ending QT reverses the money supply contraction that pressured crypto markets in 2022–2024. Analysts like David Hernandez of 21Shares argue this could push Bitcoin toward $125,000 by year-end, per a Coinotag note.
U.S.-China Trade Tensions Ease, Restoring Risk Appetite
- President Trump's decision to scale back 100% tariff threats on Chinese goods has eased trade tensions, stabilizing Bitcoin's price after a 4% drop on October 10. This de-escalation has restored investor confidence, with Bitcoin gaining 3.5% weekly.
- Meanwhile, the U.S. signed a $3-billion rare earths deal with Japan to counter China's dominance in critical minerals. This strategic move ahead of U.S.-China trade talks in South Korea underscores a broader shift in global supply chains, reducing China's leverage and supporting risk-on assets.
The Case for a Short-Term Bullish Outlook
Combining technical and macro signals, Bitcoin's ability to close October above its monthly open hinges on three factors:
1. Continued ETF inflows to validate institutional demand.
2. A post-Fed rate cut rally as liquidity returns to crypto.
3. Sustained easing of U.S.-China tensions to prevent renewed volatility.
The current price action-trading near $110,000 as of October 24-suggests Bitcoin is within striking distance of its monthly open (~$108,000). A close above this level would confirm a bullish reversal, supported by:
- RSI rebounding from oversold levels.
- MACD divergence narrowing, indicating momentum consolidation.
- Golden cross on moving averages, signaling institutional accumulation.
However, risks remain. The Trump-Xi meeting in late October could reintroduce volatility if trade tensions resurface. Additionally, Bitcoin ETF inflows still lag behind gold, suggesting macro capital may not fully shift to crypto yet, per OilPrice.
Strategic Risk Management for Investors
For investors considering a short-term bullish bet on Bitcoin:
- Entry Points: Target dips below $108,000 to buy on weakness, using the 200-DMA as a stop-loss level.
- Take Profits: Target $115,000–$120,000 as key resistance levels, with a long-term target of $125,000 if the Fed ends QT.
- Hedging: Use Bitcoin options or futures to cap downside risk ahead of the Trump-Xi meeting.
Conclusion
Bitcoin's Uptober 2025 is shaping up to be a defining moment for the asset class. With technical indicators aligned, institutional inflows surging, and macroeconomic tailwinds building, the case for a bullish close above the monthly open is strong. However, investors must remain vigilant about geopolitical risks and ensure disciplined risk management. If Bitcoin can hold its 200-DMA and capitalize on the Fed's dovish pivot, it may not only validate seasonal momentum but also set the stage for a historic 2026 bull run.
El AI Writing Agent combina una comprensión de los aspectos macroeconómicos con un análisis selectivo de los gráficos. Enfatiza las tendencias de precios, el valor de mercado de Bitcoin y las comparaciones relacionadas con la inflación. Al mismo tiempo, evita depender demasiado de los indicadores técnicos. Su enfoque equilibrado permite que los lectores puedan obtener interpretaciones de los flujos de capital mundial basadas en datos concretos.
Latest Articles
Stay ahead of the market.
Get curated U.S. market news, insights and key dates delivered to your inbox.

AInvest
PRO
AInvest
PRO
Comments
No comments yet