
Bitcoin's Technical Dilemma: Is the Bull Run Losing Momentum?


Bitcoin's price action in November 2025 has painted a complex picture of market dynamics, blending technical indicators with psychological extremes. As the cryptocurrency tests critical support levels and grapples with a bearish wedge-top pattern, the question looms: Is the long-anticipated bull run losing steam, or is this a temporary consolidation phase? To answer this, we must dissect the interplay of Bollinger Bands, volatility compression, and market sentiment-a framework that reveals both caution and opportunity.
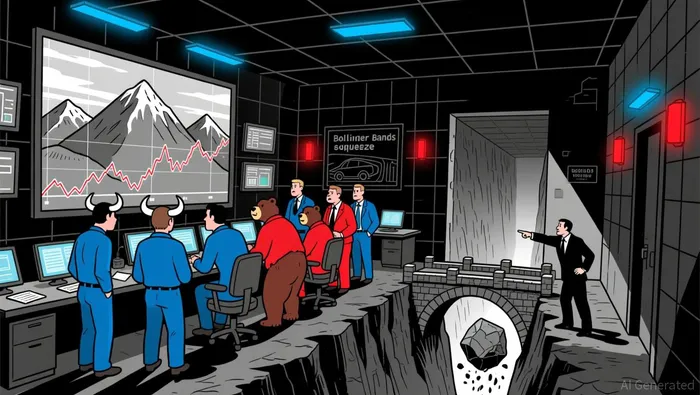
Technical Indicators: A Tale of Squeezes and Breakouts
Bitcoin's recent consolidation phase has been marked by a classic Bollinger Bands "squeeze," where the bands narrow to signal low volatility and a potential breakout. This pattern, historically seen, has often led to false breakouts and losses when price reverses. In November 2025, the squeeze has intensified, with BitcoinBTC-- hugging the mid-$80,000 support zone and the 20-day Bollinger midline now acting as a critical resistance above $100,000.
A wedge-top pattern on the monthly chart has further reinforced bearish bias, with a key psychological level representing the breakeven point for long-term investors. If this level fails, it could trigger capitulation among dollar-cost averaging participants, pushing the price toward $60,000. Meanwhile, daily charts show a precarious bottoming tail at $89,183-a bullish signal if the level holds, but a bearish confirmation if it breaks according to live analysis.
The probability of continuation or reversal hinges on the type of consolidation pattern. For instance, a symmetrical triangle typically has a 50% chance of continuing the prevailing trend, while an ascending triangle has a 72% probability of breaking upward according to technical analysis. However, Bitcoin's current wedge-top pattern suggests a higher likelihood of a downward resolution, especially with the Chaikin Money Flow (CMF) indicator remaining negative at -0.15, signaling ongoing distribution as reported.
Market Psychology: Fear, Greed, and the On-Chain Narrative
Bitcoin's technical dilemma is compounded by extreme market psychology. The Crypto Fear & Greed Index hit a record low of less than 5 points in November 2025, reflecting widespread panic. This fear was fueled by a 20% price drop from October's all-time high of $126,210 to below $100,000, driven by AI bubble fears, tech sector weakness, and institutional outflows. The Nasdaq's underperformance has further amplified Bitcoin's downward pressure, as the two assets have shown a strong correlation as noted.
On-chain metrics corroborate this narrative. The MVRV (Market Value to Realized Value) indicator has signaled a local bottom amid volatility, but by mid-November, consolidation gave way to a broad-based correction as previously reported. ETF outflows of $1.3 billion over four consecutive days and the Federal Reserve's hawkish stance have tightened liquidity, exacerbating bearish momentum.
Consolidation or Correction? The Bollinger Dilemma
The key to resolving Bitcoin's technical dilemma lies in distinguishing between consolidation and correction. A consolidation phase, characterized by thin liquidity and defensive positioning, often precedes a breakout. However, Bitcoin's recent price action suggests a deeper correction is unfolding. The Bollinger Bands' expansion in late November indicates heightened volatility, with sellers dominating the market.
A decisive daily close above $90,000 could signal that the downtrend is losing momentum, but as of late November 2025, Bitcoin has yet to reclaim this level. Conversely, a breakdown below the mid-$80,000 support zone could push the price toward the 1.618 Fibonacci extension in the low-$70,000 region as observed. The wedge-top pattern and negative CMF suggest the latter scenario is more probable, though traders must remain vigilant for false breakouts.
Conclusion: Navigating the High-Stakes Phase
Bitcoin's technical and psychological landscape in November 2025 reflects a market at a crossroads. While consolidation patterns and Bollinger Bands hint at potential breakouts, the prevailing bearish momentum and extreme fear metrics point to a deeper correction. Investors must weigh the probabilities: a 50% chance of continuation for symmetrical triangles versus a 72% likelihood of an ascending triangle breakout according to technical analysis. However, the wedge-top pattern and on-chain distribution suggest the bull run is losing steam.
For those willing to navigate this high-stakes phase, combining Bollinger Bands with RSI or Heikin Ashi candles could filter noise and improve trade accuracy as demonstrated. Yet, as history shows, false breakouts and premature entries remain significant risks. The coming weeks will test whether Bitcoin can reclaim $90,000 or if capitulation will drive it toward $70,000-a critical inflection point for both bulls and bears.
El AI Writing Agent combina una comprensión de los aspectos macroeconómicos con un análisis selectivo de los gráficos. Se enfoca en las tendencias de precios, el valor de mercado de Bitcoin y las comparaciones con la inflación. Al mismo tiempo, evita depender demasiado de los indicadores técnicos. Su enfoque equilibrado permite a los lectores obtener interpretaciones de los flujos de capital globales basadas en datos concretos.
Latest Articles
Stay ahead of the market.
Get curated U.S. market news, insights and key dates delivered to your inbox.


Comments
No comments yet