
Bitcoin Surges 1.49% to $107,000, Eyes $120,000 Resistance
Bitcoin is currently testing the upper boundary of a rising channel that has been guiding its price for over 520 days, with the cryptocurrency approaching $108,000. This level is significant as it mirrors a structure from the 2020–2021 cycle, where similar resistance zones were observed. Traders are now closely watching for confirmation of a breakout or rejection within this pattern.
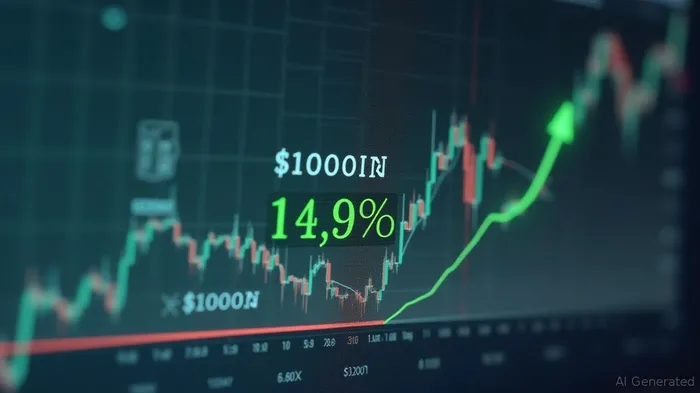
Bitcoin's price has been on a steady climb from the $49,000 support zone, reaching $107,544. This current level aligns with the channel’s upper edge, marked by a long-standing resistance line. Technical analysts note that this pattern is reminiscent of the late 2020 and early 2021 cycle pump. The orange upward sloping channel frames this rising trend, within which two historical cup-and-handle patterns appear, each followed by major rallies. The price also moved within a descending wedge after its last high near $100K, indicating correction and consolidation.
A recent breakout from the wedge and return to higher lows signal renewed momentum. Bitcoin’s Relative Strength Index (RSI) reads 56.77, suggesting moderate strength and potential for further upward movement. If momentum holds, BTC could break the $108K resistance and aim for the $120K level indicated on the chart. Key levels show resistance at $108K and a target at $120K. The chart’s structure highlights several key zones: the lower support at $49,171.99, the mid-channel region near $100K, and the top at $120K. Price behavior at the top resistance line will decide the short-term trend. A confirmed break above this range may accelerate upward movement.
Analysts observe that this channel has guided price action for over 524 days. The upper boundary has previously rejected price attempts but now sees renewed pressure from buyers. This retest aligns with a significant historical pattern marked as the “Pre Pump Correction.” The white projected path from the current price area suggests a possible parabolic move if the resistance flips into support. The green arrows point to a bullish continuation, while the “?” label introduces the scenario of rejection. Market watchers now await volume confirmation for any decisive shift.
Traders are asking a key question: Can Bitcoin break above $108K and turn the channel ceiling into long-term support? Past behavior around these zones shows Bitcoin tends to make large moves when testing multi-year resistance. If BTC clears this level, the projected $120K target could be reached within weeks. The chart also reflects similarities to late 2020 when Bitcoin broke out and surged past all-time highs. This scenario plays out as global liquidity expands, and institutional flows grow. The chart’s lower support has held since 2023, adding weight to this trend. Should the breakout occur, this structure may define the next major leg in Bitcoin’s price journey.
Bitcoin has surged to $107,000, driven by a confluence of factors including geopolitical stability, dovish signals from the Federal Reserve, and a decline in oil prices. This upward momentum has analysts eyeing a potential breakout toward the $120,000 resistance level. The cryptocurrency has shown resilience, trading within a range of $106,132 to $108,129 over the past 24 hours, reflecting a 1.49% increase. This bullish trend is supported by technical patterns that suggest further gains are possible. The current price action indicates that Bitcoin is poised to challenge the $120,000 resistance level, which could mark a significant milestone in its recent bull run. Investors and analysts are closely monitoring these developments, as a successful breakout could signal continued strength in the cryptocurrency market.
Stay ahead of the market.
Get curated U.S. market news, insights and key dates delivered to your inbox.


AInvest
PRO
AInvest
PRO
Comments
No comments yet