
Bitcoin’s Short-Term Range-Bound Outlook and Strategic Breakout Potential: A Technical and Risk Management Analysis


Bitcoin’s price action in August 2025 has painted a nuanced picture of a market teetering between consolidation and breakout potential. Technical indicators suggest a range-bound pattern, but subtle shifts in momentum and institutional activity hint at a possible directional move. For near-term traders, understanding these dynamics—and pairing them with disciplined risk management—is critical to navigating the volatility.
Technical Analysis: A Tightrope of Momentum and Volatility
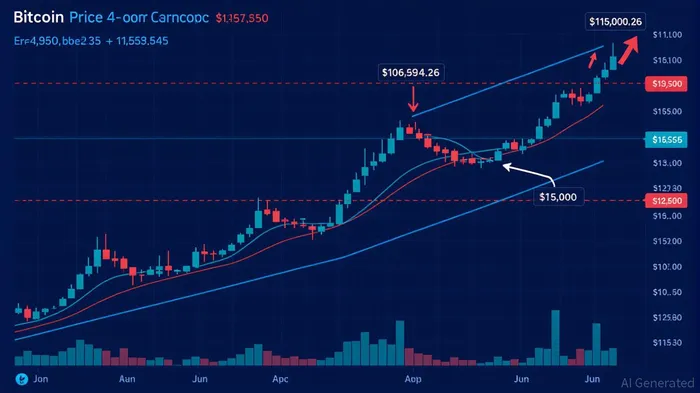
Bitcoin’s recent performance reveals a tug-of-war between bullish and bearish forces. On August 24, BTCUSDT broke above $115,000, forming a bullish continuation pattern, while the MACD remained in positive territory with expanding momentum [1]. The 20-period RSI at 54 and BollingerBINI-- Band positioning in the upper half of the channel suggest the price is not yet overbought but remains in a high-probability bullish zone [1]. However, this optimism is tempered by recent bearish divergence. On August 31, BitcoinBTC-- tested the lower Bollinger Band at $106,494.26, with RSI dropping to 38.62—a near-oversold level—while the MACD histogram turned negative, signaling caution [4].
Fibonacci retracement levels add further clarity. A retest of $115,025 or $115,675 could confirm bullish momentum, as the price remains above both the 50-day and 20-period EMAs [1]. Yet, the August 13 overbought RSI spike (peaking at 78) serves as a cautionary tale: historical data from 2025 shows a 3% pullback often follows such extremes [3]. This duality—bullish structure versus short-term exhaustion—creates a high-stakes environment for traders.
Risk Management: Balancing Exposure in a Volatile Market
Bitcoin’s volatility in 2025 has been a double-edged sword. While institutional adoption and spot ETFs have reduced volatility from 60% to 30% by August, the $110,000 psychological level remains fragile under macroeconomic shifts [1]. For near-term traders, this necessitates a layered approach to risk management:
Position Sizing and Leverage: Limiting risk to 1–2% of total capital per trade is a cornerstone strategy [2]. Leveraged traders must avoid excessive leverage (e.g., 50x–1000x), as August 2025 saw $343 million lost in over-leveraged positions [1]. Conservative 10x leverage, combined with strict position sizing, preserved 60–70% of capital during a 15% EthereumETH-- crash in the same period [1].
Stop-Loss Automation: A 5% stop-loss at $104,500 for a long position at $110,000 is a standard practice [1]. Trailing stops become vital during rallies, dynamically adjusting to lock in gains while avoiding premature exits. During volatile periods, widening stops (e.g., from 5% to 7%) can prevent false breakouts from triggering unnecessary exits [6].
Volatility-Adjusted Strategies: Traders should scale back exposure when volatility resurges—such as during Fed policy updates or macroeconomic surprises [1]. Hedging with crypto options or shorting correlated assets like Ethereum can further mitigate downside risks [1].
Strategic Breakout Potential: When to Act
A breakout from the current range would likely be triggered by a confluence of factors: a sustained close above $115,675 (a Fibonacci resistance level), a bullish MACD crossover, and a RSI re-entry into overbought territory (above 60) [1]. Conversely, a breakdown below $106,494.26 would signal a shift in sentiment, requiring immediate risk mitigation.
Institutional buying by firms like MicroStrategy adds another layer of complexity. While such activity can stabilize prices during pullbacks, it also introduces liquidity risks if selling pressure overwhelms buying interest [4]. Traders should monitor on-chain metrics—such as exchange inflows and large wallet activity—to gauge institutional intent.
Conclusion
Bitcoin’s short-term outlook remains a delicate balance of technical signals and macroeconomic forces. For near-term traders, the key lies in combining precise technical analysis with robust risk management. By adhering to disciplined position sizing, automated stop-losses, and volatility-adjusted strategies, traders can position themselves to capitalize on potential breakouts while safeguarding capital in a volatile environment.
**Source:[1] Bitcoin (BTCUSDT) Climbs to New 24-Hour High [https://www.ainvest.com/news/market-overview-bitcoin-btcusdt-climbs-24-hour-high-2508/][2] Crypto Risk Management Strategies for Trading (2025) [https://changelly.com/blog/risk-management-in-crypto-trading/][3] Bitcoin RSI Overbought Analysis 4H – Aug 13, 2025 [https://windrush.io/bitcoin-rsi-overbought-analysis-4h-aug-13-2025/][4] Bitcoin RSI Hits 38.62 as BTC Price Consolidates Near $108K [https://blockchain.news/news/20250831-bitcoin-rsi-hits-3862-as-btc-price-consolidates-near-108k]
Decoding blockchain innovations and market trends with clarity and precision.
Latest Articles
Stay ahead of the market.
Get curated U.S. market news, insights and key dates delivered to your inbox.


Comments
No comments yet