
Bitcoin’s Rally Fails — And the Downtrend Returns
 Aime Summary
Summary
- Bitcoin/USDC trades near $63,490 after testing resistance and showing indecision candles.
- 24h volume is elevated compared to recent averages, suggesting active participation.
- Market structure indicates a lower low, pointing to short-term weakness.
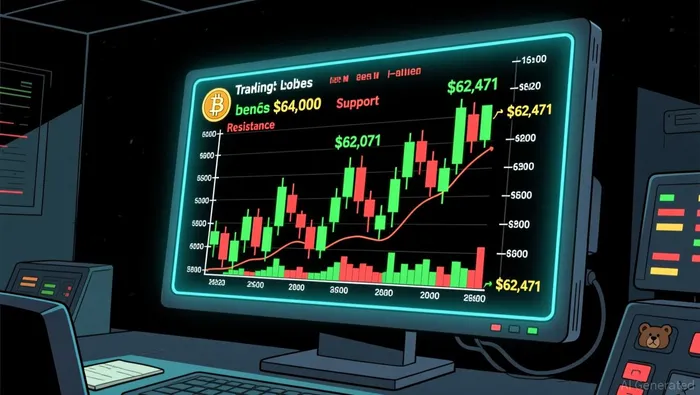
- Key resistance sits around $63,924 with support near $62,471.
- A break below support could trigger further downside momentum.
Range Bound with Downside Pressure
Bitcoin/USDC (BTCUSDC) closed at $63,490.99 on 2026-08-04, with a 24-hour trading volume of approximately 118.5 USDC. The asset has experienced mixed signals, balancing between recent support tests and resistance rejections.
1-Hour Support/Resistance and Candlestick Patterns
Price action in the last 24 hours reveals a clear interaction with immediate support and resistance levels. The most recent low of $62,471.51 on August 3 acted as a strong support base, where buyers stepped in to push prices back up to $63,924.08. This upper boundary served as a resistance zone, evidenced by the doji and long upper shadow candles observed between 15:00 and 16:00 on August 3. These patterns suggest that selling pressure emerged when the price approached the $64,000 psychological mark, preventing a sustained breakout. The bullish engulfing candle at 00:00 on August 4 indicates a temporary shift in momentum, but the subsequent bearish engulfing pattern at 06:00 suggests that sellers are regaining control. The price is currently closer to the immediate support level of $62,471 than the resistance at $63,924, as the recent high was rejected. The presence of long lower shadows in the early hours of August 4 indicates that dips are being bought, but the inability to hold above $63,700 shows underlying weakness.
Volume and Turnover vs. Historical Comparison
The 24-hour total volume of approximately 118.5 USDC is significantly higher than the 7-day average daily volume of 133.18 USDC and the 15-day average of 147.98 USDC, indicating a notable increase in trading activity. Specific hours showed volume spikes well above the 7-day average single-hour volume of 5.55 USDC. For instance, the hour ending at 11:00 on August 3 recorded a volume of 13.76 USDC, which is more than double the average. This spike coincided with a price increase from $63,289 to $63,639, suggesting that the volume supported the upward move. However, the hour ending at 10:00 on August 3 saw a volume of 12.19 USDC with a price rise to $63,896, followed by a pullback, indicating some distribution at higher levels. The volume spike at 00:00 on August 4 (8.11 USDC) was accompanied by a price increase to $63,989, but the subsequent hours saw declining volume and price, suggesting that the buying pressure was not sustained. These anomalies suggest that while volume is elevated, it has not consistently driven price in a single direction, indicating a contested market.
Look Back: Current Market Phase
The broader market structure over the last 7-15 days points to a downtrend. The market structure feature is identified as a lower low, and the 7-day price change is negative at -0.93%, while the 3-day change is positive at 1.10%. This divergence suggests that the recent short-term rally is a correction within a larger downtrend. The price range over the last 15 days has been approximately $4,684, which indicates significant volatility. The current price of $63,490 is below the recent highs seen in late July, such as the high of $66,379 on July 24. The presence of lower highs and lower lows in the 7-day timeframe confirms that sellers are in control. The market appears to be in a corrective phase within a downtrend, where short-term bounces are being met with selling pressure. This suggests that the current upward movement may be temporary and subject to reversal if support levels are breached.
The market may continue to test support levels in the next 24 hours, with a break below $62,471 potentially leading to further downside. Upside risk is limited unless the price can sustainably break above $63,924, which could signal a shift in momentum.

Decoding market patterns and unlocking profitable trading strategies in the crypto space
Latest Articles
Stay ahead of the market.
Get curated U.S. market news, insights and key dates delivered to your inbox.


AInvest
PRO
AInvest
PRO




Comments
No comments yet