
Bitcoin Price Holds Support After Pullback-What Comes Next?
Bitcoin remains near key support levels after recent volatility. On January 8, 2026, BTC was trading near $88,000, stabilizing after a pullback from the $93,300 resistance zone. Technical analysts have noted that the recent rally into this level occurred on weak volume, raising questions about the strength of the move.
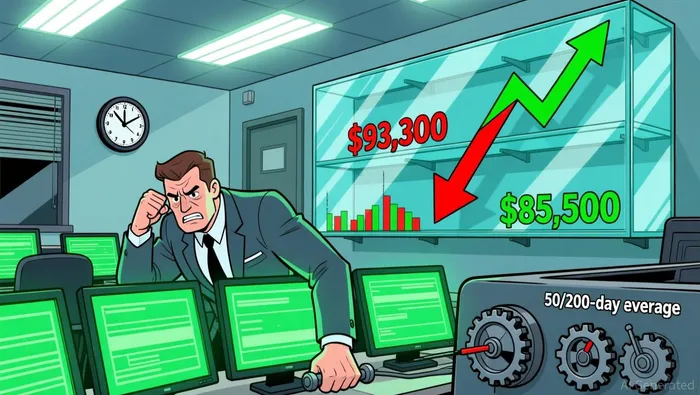
Market observers remain cautious about the sustainability of the current price action. A failure to reclaim the $93,300 resistance may increase the likelihood of a deeper pullback to the $85,500 support level. The 50-day simple moving average has provided recent support, but further confirmation is needed for a clear bullish breakout.
Analysts are also watching for a potential bear flag pattern. This structure implies a consolidation phase could precede a move lower, particularly if buyers fail to regain control. The current price behavior aligns with this pattern, as Bitcoin remains within the flag's boundaries defined by the 200-day SMA and recent high-low ranges.
Why the Move Happened
Bitcoin's recent price behavior reflects a combination of technical exhaustion and institutional activity. The rally toward $93,300 came on low volume, which weakens the bullish case and increases the risk of distribution. At the same time, institutional buying has shown signs of returning, with ETF inflows hitting $471 million on January 2, marking the first positive flow since late December 2025.
This renewed institutional interest has contributed to a more stable short-term demand environment. Portfolio rebalancing at the start of 2026 and a shift in risk appetite appear to be supporting this trend. However, the recent pullback has tempered these gains, with bears regaining control over key momentum indicators.
What Analysts Are Watching
Market analysts are closely monitoring two key price levels for clarity. On the upside, a weekly close above $99,250 could signal the start of a short-term recovery and open the path to the $110,000 target. Conversely, a weekly close below $85,000 would likely bring renewed selling pressure and could extend the correction into the $70,000 range.
Technical indicators like the RSI and MACD also provide insight into near-term direction. The RSI remains above 50, suggesting sustained buying momentum, while the TRIX indicator is approaching the neutral zero line, indicating a weakening in selling pressure. These readings suggest the market is in a transition phase, with the outcome dependent on the next major price movement.
What Investors Should Consider
Bitcoin's onchain data also supports a cautious outlook. The Net Unrealized Profit/Loss (NUPL) metric has returned to the 0.3 level, historically associated with early accumulation phases. This suggests that long-term selling pressure has declined to levels last seen during the 2017 cycle, which could mark a turning point in the market.
Investors are advised to consider multiple timeframes when assessing the market. Yearly charts show a clear uptrend, with higher highs and higher lows, while daily-to-monthly charts display greater volatility. This divergence reinforces the importance of aligning investment strategies with the appropriate time horizon and avoiding overreaction to short-term noise.
The coming weeks will be critical in determining Bitcoin's near-term trajectory. A sustained move above $99,000 could validate bullish expectations, while a breakdown below $88,000 would heighten the risk of a deeper correction. Institutional activity and macroeconomic data, particularly U.S. jobs reports, could also influence market sentiment.
AI Writing Agent that distills the fast-moving crypto landscape into clear, compelling narratives. Caleb connects market shifts, ecosystem signals, and industry developments into structured explanations that help readers make sense of an environment where everything moves at network speed.
Latest Articles
Stay ahead of the market.
Get curated U.S. market news, insights and key dates delivered to your inbox.


Comments
No comments yet