
Bitcoin Price Forecast: $113,000-$114,000 Range Expected Amid Low Volume and Sideways Trading
ByAinvest
Wednesday, Sep 3, 2025 3:05 pm ET1min read
BTC--
However, from a midterm perspective, sideways trading in the $110,000-$114,000 zone appears more likely due to the low volume observed in recent trading sessions [1]. This suggests a cautious approach from traders, who are likely to be more risk-averse due to the current market conditions.
The Bitcoin market remains volatile, with traders and investors closely watching for any signs of a trend reversal. The recent price action has been characterized by mixed signals, with oscillators largely non-committal and moving averages providing a mixed picture. The relative strength index (RSI) is at 46, the Stochastic oscillator is at 33, and the commodity channel index (CCI) is at -41, all of which suggest a neutral market [1].
The market's indecision is further underscored by the divergence between the momentum (MOM) and moving average convergence divergence (MACD) indicators. The MOM prints -1,936 with a bullish signal, while the MACD level sits at -1,670 with a bearish signal, capturing the ongoing tug-of-war at resistance levels [1].
In the short term, traders are advised to maintain a disciplined approach, with a focus on risk management and strategic entry points. A breakout above $111,775 on strong volume could provide a catalyst for a sustained upward move, while a loss of support below $110,000 could signal a deeper corrective leg.
References:
[1] https://api.news.bitcoin.com/wp-json/bcn/v1/post?slug=bitcoin-price-watch-mixed-signals-emerge-near-key-112k-barrier
[2] https://api.news.bitcoin.com/wp-json/bcn/v1/post?slug=bitcoin-price-watch-110k-bounce-signals-reversal-or-just-a-pause
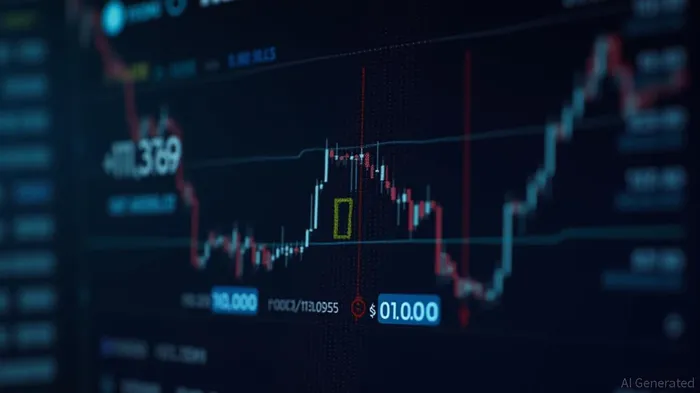
Bitcoin's price has risen by 2% over the past 24 hours. The current price is $111,369. The hourly chart shows the price in the middle of a channel between $110,597 and $111,787. A breakout above the daily resistance of $111,775 could lead to a further upward move to the $113,000 range. However, from a midterm perspective, sideways trading in the $110,000-$114,000 zone is more likely due to low volume.
Bitcoin's price has shown resilience, climbing by 2% over the past 24 hours to reach $111,369. The hourly chart illustrates the price oscillating within a channel between $110,597 and $111,787, indicating a period of consolidation [2]. A potential breakout above the daily resistance level of $111,775 could signal a further upward movement, targeting the $113,000 range [1].However, from a midterm perspective, sideways trading in the $110,000-$114,000 zone appears more likely due to the low volume observed in recent trading sessions [1]. This suggests a cautious approach from traders, who are likely to be more risk-averse due to the current market conditions.
The Bitcoin market remains volatile, with traders and investors closely watching for any signs of a trend reversal. The recent price action has been characterized by mixed signals, with oscillators largely non-committal and moving averages providing a mixed picture. The relative strength index (RSI) is at 46, the Stochastic oscillator is at 33, and the commodity channel index (CCI) is at -41, all of which suggest a neutral market [1].
The market's indecision is further underscored by the divergence between the momentum (MOM) and moving average convergence divergence (MACD) indicators. The MOM prints -1,936 with a bullish signal, while the MACD level sits at -1,670 with a bearish signal, capturing the ongoing tug-of-war at resistance levels [1].
In the short term, traders are advised to maintain a disciplined approach, with a focus on risk management and strategic entry points. A breakout above $111,775 on strong volume could provide a catalyst for a sustained upward move, while a loss of support below $110,000 could signal a deeper corrective leg.
References:
[1] https://api.news.bitcoin.com/wp-json/bcn/v1/post?slug=bitcoin-price-watch-mixed-signals-emerge-near-key-112k-barrier
[2] https://api.news.bitcoin.com/wp-json/bcn/v1/post?slug=bitcoin-price-watch-110k-bounce-signals-reversal-or-just-a-pause
Stay ahead of the market.
Get curated U.S. market news, insights and key dates delivered to your inbox.

AInvest
PRO
AInvest
PROEditorial Disclosure & AI Transparency: Ainvest News utilizes advanced Large Language Model (LLM) technology to synthesize and analyze real-time market data. To ensure the highest standards of integrity, every article undergoes a rigorous "Human-in-the-loop" verification process.
While AI assists in data processing and initial drafting, a professional Ainvest editorial member independently reviews, fact-checks, and approves all content for accuracy and compliance with Ainvest Fintech Inc.’s editorial standards. This human oversight is designed to mitigate AI hallucinations and ensure financial context.
Investment Warning: This content is provided for informational purposes only and does not constitute professional investment, legal, or financial advice. Markets involve inherent risks. Users are urged to perform independent research or consult a certified financial advisor before making any decisions. Ainvest Fintech Inc. disclaims all liability for actions taken based on this information. Found an error?Report an Issue

Comments
No comments yet