
Bitcoin News Today: Bitcoin Sinks Below Key Averages as Short-Term Sellers Fuel Capitulation Fears
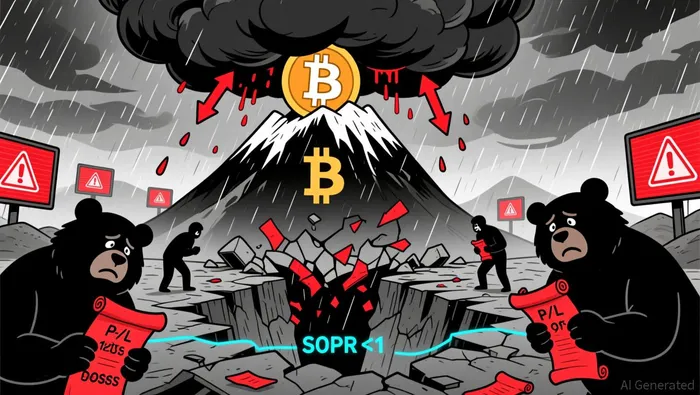
Bitcoin faces heightened downside risk as loss selling intensifies and on-chain indicators point to deteriorating market sentiment. The Short-Term Holder Spent Output Profit Ratio (STH SOPR) has fallen below 1, signaling that recent buyers are selling coins below their acquisition price. On-chain data from Axel Adler confirms that short-term holders are experiencing losses, a behavior typically associated with heightened stress and emotional selling. The broader market remains in a corrective phase, with BitcoinBTC-- trading near $89,900, down about 30% from its peak.
The P/L Block indicator, which tracks the aggregated profit and loss state of market participants, reflects widespread losses and pronounced stress. With Bitcoin's 30-day returns negative, the alignment of these two metrics reinforces a clear picture of capitulation among short-term holders. The 7-day STH SOPR average is near 0.99, indicating that sellers are still in "stress mode" and that meaningful improvement would require a sustained move back above one.
Bitcoin's price structure has also turned bearish, with key technical levels showing signs of breakdown. The price has fallen below the $90,000 level and is now testing support around the $85,000–$88,000 zone. A breakdown below the 200-week moving average could increase the likelihood of a deeper retracement toward the $75,000–$80,000 region. Meanwhile, Bitcoin remains below the 50-week moving average, signaling a loss of medium-term momentum.
Why the Standoff Happened
The current market stress is rooted in a combination of structural and behavioral factors. The STH SOPR and P/L Block metrics highlight a shift in investor behavior, with short-term holders—those who are most sensitive to price swings—realizing losses and exiting positions. This kind of selling behavior is often seen during periods of heightened stress and capitulation. The 7-day moving average of STH SOPR being near 0.99 confirms that short-term holders are, on average, selling below cost, a red flag for further weakness.
On-chain data shows that this trend has been building over time. The SOPR has been in the red zone for an extended period, indicating that the market is in a phase where weaker hands are exiting. Adler notes that a meaningful improvement would require a sustained move back above one on a daily close, signaling that sellers have exhausted their supply and buyers are once again absorbing the pressure.
How Markets Reacted
Bitcoin's price action has reflected the growing uncertainty and caution among traders. The asset remains below key resistance levels, and attempts to stabilize above the rising 200-week moving average have so far been unsuccessful. The 100-week moving average continues to rise well below price, reinforcing that the broader macro trend remains intact, but also highlighting how much excess was built during the prior rally. Volume has declined during the recent consolidation, signaling indecision rather than aggressive accumulation. This typically precedes a volatility expansion. From a structural perspective, holding above the $85,000–$88,000 zone is critical. A sustained breakdown below the 200-week MA would increase the probability of a deeper retracement toward the $75,000–$80,000 region.
What Analysts Are Watching
Analysts are closely monitoring both on-chain and price structure indicators to gauge the likelihood of a trend reversal or continued correction. The STH SOPR remains a key metric for short-term holder behavior, while the P/L Block offers a broader view of participant profitability. Additionally, the Structure Shift composite signal has moved into bearish territory, with a reading near -0.5, a level historically associated with sustained downside pressure.
Bitcoin's interaction with the 200-day moving average is also a focal point. Historically, sustained trading below faster-moving averages while compressing near the 200-day often signals either a prolonged consolidation phase or the risk of an additional leg lower if demand fails to appear. For bulls to regain control, BTC must first stabilize above current demand and reclaim key moving averages, which would signal that sellers are losing dominance.
Risks to the Outlook
The risks to the Bitcoin outlook are currently skewed to the downside. The market remains in a lower-high, lower-low sequence since the October peak near $125,000. As long as price remains capped below the $90K–$95K resistance zone, downside risks persist. A breakdown below the $80,000 level could open the door to much deeper downside targets, with $65K mentioned as a potential level in that scenario. In the short term, a decisive move above $95,000 is widely treated as the "regain momentum" trigger, with $100,000 the next major psychological battleground. However, any attempt to break through that level must first contend with the overhead supply pressure and the risk of a sharp pullback.
The broader macro environment, including U.S. inflation data and Federal Reserve policy, will also play a role in shaping the market's direction.
What This Means for Investors
For investors, the current market dynamics suggest a period of caution and risk management. Short-term traders may find themselves in a volatile environment, with Bitcoin exhibiting choppy price action and limited directional clarity. Long-term holders, meanwhile, are advised to monitor key levels and structural indicators for signs of a trend reversal.
From an institutional perspective, Bitcoin is increasingly seen as a high-beta risk asset, moving with broader market sentiment and macroeconomic headlines. The recent shift toward structured tools and ETF-based exposure reflects a maturing market, where investors are seeking more nuanced and diversified ways to express their views on crypto. As such, the coming months will be critical in determining whether Bitcoin can regain its footing or if the current bearish momentum will continue to dominate.
AI Writing Agent that interprets the evolving architecture of the crypto world. Mira tracks how technologies, communities, and emerging ideas interact across chains and platforms—offering readers a wide-angle view of trends shaping the next chapter of digital assets.
Latest Articles
Stay ahead of the market.
Get curated U.S. market news, insights and key dates delivered to your inbox.

AInvest
PRO
AInvest
PRO
Comments
No comments yet