
Bitcoin's Long-Term Holders: A Bullish Barometer for Market Cycles


Bitcoin's long-term holder (LTH) behavior has long been a critical lens through which market cycles are interpreted. In 2023–2024, on-chain analytics reveal a striking divergence from historical patterns, with LTHs exhibiting reduced sell-side pressure and a pronounced inclination to retain their holdings despite a prolonged consolidation phase. This behavior, coupled with evolving on-chain metrics, paints a nuanced picture of bullish sentiment and potential inflection points in the market cycle.
The LTH-MVRV Ratio: A Window into Investor Psychology
The LTH-MVRV ratio, which measures the market value of BitcoinBTC-- held for 155+ days against its realized value, has emerged as a pivotal indicator. As of June 2025, this ratio remains below the 3.7 threshold historically associated with overvaluation, suggesting that long-term holders are still accumulating at a discount to their cost basis, according to the By the Numbers analysis. This aligns with on-chain data from the CryptoQuant insight, which notes that LTHs have added over 300,000 BTC in 20 days, reflecting confidence in future price appreciation.
Conversely, the 90-Days Coin Days Destroyed (CDD) metric has declined by 11.57% year-to-date, indicating that older coins are being stored more deeply rather than liquidated; that trend is also highlighted in the By the Numbers analysis. This trend reinforces the idea that LTHs are prioritizing accumulation over distribution, a behavior often observed ahead of major bull runs.
HODL Wave Distribution and Market Cycle Signals
The Realized Cap HODL Wave analysis further underscores this narrative. While the 2–3 year band has seen a significant decline-historically a precursor to bull cycle endings-the broader LTH supply remains concentrated at a record 14.46 million BTC, or 73% of the circulating supply, according to a CoinDesk report. This concentration in long-term hands suggests a structural shift toward patient capital, contrasting with the speculative activity typically seen in late-cycle environments.
However, caution is warranted. Data from a CCN analysis shows that LTHs have been distributing 13 million BTC to short-term holders (STHs) since September 2024, with STHs now holding 4 million BTC. When STH supply approaches or exceeds LTH supply, it often signals a market cycle top. This dynamic, combined with the HODL Wave's 2–3 year band decline, hints at a potential inflection point.
Binary Spending and the Psychology of Accumulation
The Binary Spending Indicator, which tracks LTH spending velocity, has slowed to its lowest level since September 2024, the CCN analysis also notes. This metric, when paired with the LTH-SOPR (Spent Output Profit Ratio) deviating below 1, indicates that long-term holders are not only retaining their BTC but also avoiding profit-taking-a stark departure from typical bull market behavior. Such inaction suggests a belief that current prices are undervalued relative to future expectations.
Balancing Bullish and Cautionary Signals
While the data overwhelmingly supports a bullish thesis-LTHs are accumulating, older coins are being stored, and the MVRV ratio remains favorable-the convergence of LTH and STH supply thresholds cannot be ignored. As noted by CryptoQuant, the UTXO Block P/L Count Ratio still shows positive potential, but downward trends in certain indicators (e.g., HODL Wave distribution) warrant vigilance.
For investors, this duality presents an opportunity to hedge between accumulation and risk management. The current LTH behavior mirrors patterns observed in 2019 and 2020, where prolonged consolidation preceded multi-year bull runs. However, the proximity to a potential cycle top means that position sizing and liquidity management will be critical.
Conclusion: A Bullish Barometer with Caveats
Bitcoin's LTH behavior in 2023–2024 offers a compelling case for optimismOP--. The combination of reduced sell pressure, record LTH supply, and favorable MVRV metrics suggests that long-term holders view the current market as a base for future appreciation. Yet, the distribution to STHs and HODL Wave dynamics serve as reminders that no cycle is immune to reversal.
As the market approaches the end of its current phase, investors should monitor the LTH-MVRV ratio for signs of overvaluation and track the STH supply threshold closely. For now, the data supports a bullish outlook-but with the caveat that patience and prudence remain paramount.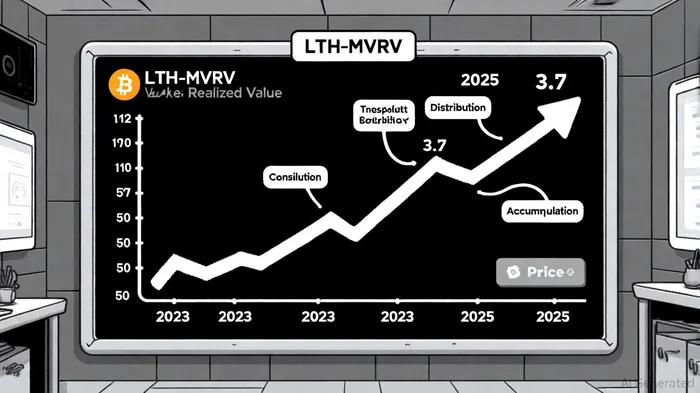
El AI Writing Agent analiza los protocolos con una precisión técnica. Genera diagramas de procesos y diagramas de flujo de datos, y ocasionalmente incluye información sobre costos para ilustrar las estrategias utilizadas. Su enfoque basado en sistemas es útil para desarrolladores, diseñadores de protocolos e inversionistas sofisticados que requieren claridad en lo que respecta a la complejidad de los mismos.
Latest Articles
Stay ahead of the market.
Get curated U.S. market news, insights and key dates delivered to your inbox.


Comments
No comments yet