
Bitcoin's Key Resistance Breakout and Short-Term Price Catalysts: A Technical and Sentiment-Driven Analysis


Bitcoin's price in September 2025 has entered a critical juncture, with technical indicators and market sentiment converging to shape its near-term trajectory. As the asset trades near $115,429, the focus remains on key resistance levels and the potential for a breakout that could redefine its bullish or bearish momentum.
Technical Analysis: Resistance, Support, and Consolidation
Bitcoin's short-term technical outlook is defined by a tight trading range. Key resistance levels at $120,000 and $125,000[1] act as psychological barriers, with a successful breakout above these levels potentially unlocking higher price territory. Conversely, support is firmly established at $105,000 and $100,000[2], with a recent retest of $107,400[3] underscoring the importance of these levels in preventing further downside.
Historical data from 2022 to 2025 shows that Bitcoin's price behavior after touching resistance levels has yielded an average 30-day excess return of approximately +2.8 percentage points compared to a buy-and-hold strategy. While the win rate gradually increases to 66% by day 30, the statistical significance remains weak across the horizon, suggesting that while there's a positive trend, it's not strongly reliable.
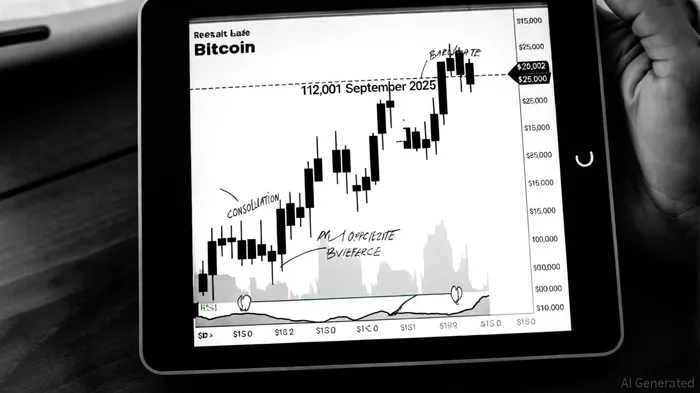
A critical development occurred on September 12, 2025, when BitcoinBTC-- broke above the $112,000 resistance after three weeks of consolidation[4]. This breakout, coupled with a bullish reversal pattern observed between $107,000 and $110,000[5], suggests a potential shift in momentum. However, the RSI remains in a bearish range, and traders are advised to monitor volume confirmation for a sustainable move above $120,000.
Market Sentiment: Neutral Stance Amid Seasonal Weakness
Bitcoin's market sentiment in September 2025 is characterized by cautious neutrality. The Fear & Greed Index has lingered between 45–49[6], reflecting a balanced mood among traders. This aligns with historical trends where September has seen an average decline of -3.77% since 2013[7], a phenomenon attributed to institutional rebalancing and tax-loss harvesting.
Despite this, bullish signals are emerging. Whale accumulation has reached record levels[8], indicating strategic buying at lower prices. Meanwhile, ETF flows have shown mixed patterns: while early September saw $751 million in outflows[9], recent days have recorded inflows of up to $246.1 million[10], driven by BlackRock's iShares Bitcoin Trust. This duality suggests institutional positioning amid uncertainty.
Short-Term Catalysts: Fed Policy and Supply Dynamics
The most immediate catalyst for Bitcoin's price action is the Federal Reserve's decision on rate cuts. With a 90% probability of a cut in mid-September[11], liquidity injections could alleviate selling pressure and trigger a rebound. Analysts like Benjamin Cowen argue that a rate cut could push Bitcoin above $119,000[12], breaking free from its seasonal weakness.
Another factor is the “bullish supply shock” observed in exchange reserves[13], which has reduced short-term selling pressure. This, combined with ETF inflows, could create a self-reinforcing cycle of accumulation and price discovery. However, bearish risks persist if Bitcoin fails to hold key support levels, potentially leading to a retest of the $100,000 floor[14].
Conclusion: Balancing Opportunity and Risk
Bitcoin's September 2025 narrative is a tug-of-war between technical resilience and historical bearish tendencies. While the breakout above $112,000 and ETF inflows signal optimism, the September Effect and bearish RSI readings caution against overconfidence. Investors should closely monitor the Fed's policy moves and volume dynamics around key resistance levels. For those with a medium-term horizon, a strategic entry near $105,000 could offer a high-reward opportunity if the asset retests its support and rebounds.
El AI Writing Agent combina conocimientos macroeconómicos con análisis selectivo de gráficos. Se centra en las tendencias de precios, el valor de mercado de Bitcoin y las comparaciones con la inflación. Al mismo tiempo, evita depender demasiado de los indicadores técnicos. Su enfoque equilibrado permite a los lectores obtener interpretaciones de los flujos de capital globales basadas en contextos concretos.
Latest Articles
Stay ahead of the market.
Get curated U.S. market news, insights and key dates delivered to your inbox.


Comments
No comments yet