
Bitcoin Hits 64,000 Wall Amid Sluggish Volume
 Aime Summary
Summary
- Bitcoin/Tether trades near 63,745 USDT within a defined consolidation range.
- Volume remains subdued compared to recent averages, indicating low conviction.
- Market structure shows lower highs, suggesting persistent bearish pressure.
- Key resistance at 64,000 USDT caps immediate upside potential.
- Downside risk exists if support near 63,500 USDT fails.
Market Overview: Consolidation with Downside Pressure
Bitcoin/Tether (BTCUSDT) last traded at 63,745.00 USDT on the 1-hour chart, with a 24-hour total volume of approximately 1,900 BTC. The asset exhibits cautious behavior as buyers and sellers battle for control within a narrow band.
1-Hour Support/Resistance and Candlestick Patterns
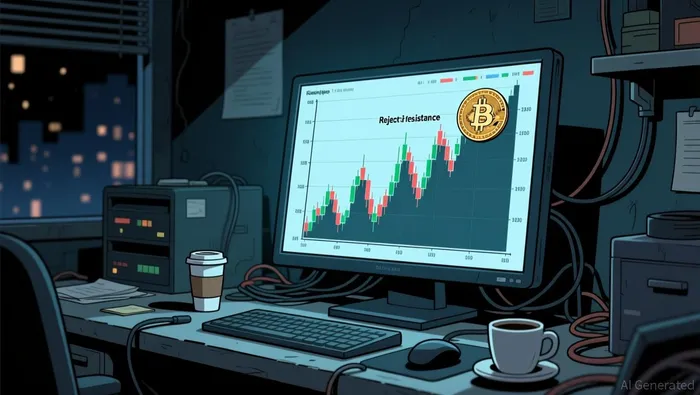
Price action reveals a clear dynamic between defined support and resistance zones. The asset encountered significant rejection near the 64,000 USDT level, where multiple candles formed long upper shadows, indicating strong selling pressure at higher prices. Specifically, the 12:00 and 07:00 candles on August 3-4 displayed wicks extending well above their bodies, confirming resistance. Conversely, the 63,500 USDT area has acted as a floor, with candles like the one at 18:00 on August 3 showing long lower shadows that suggest buyers are stepping in to defend this level. The current price sits closer to the resistance cluster than the support base, creating a constrained trading environment. The presence of doji candles and long-wick rejections suggests indecision, but the repeated failure to break above 64,000 USDT leans toward a bearish bias in the short term.
Volume and Turnover vs. Historical Comparison
The 24-hour trading volume is notably lower than the 7-day and 15-day average daily volumes. The 7-day average daily volume stands at 2,780.43 BTC, while the 15-day average is 2,488.13 BTC. Current hourly volumes rarely exceed the 7-day average single-hour volume of 115.85 BTC, with only the 09:00 hour on August 3 showing a spike to 237.06 BTC. This spike was followed by a modest 3-hour price gain of roughly 0.65%, but it failed to sustain momentum, leading to a gradual decline in the subsequent hours. The lack of sustained high volume during price movements suggests that the recent volatility is not driven by strong institutional participation. Instead, it appears to be retail-driven noise. The absence of significant volume anomalies supporting price breaks indicates that neither bulls nor bears have established decisive control.
Look Back: Current Market Phase
The 7-15 day market structure is characterized by lower highs and lower lows, placing Bitcoin/Tether in a downtrend phase. The 7-day price change is negative at approximately 0.65%, while the 3-day change is slightly positive at 1.39%, which may indicate a short-term correction within the broader downtrend. The 15-day daily price range of 4,684.78 USDT shows moderate volatility, but the direction remains downward. The market does not meet the criteria for a sideways range (≤10%) nor an uptrend, and there is no evidence of a mean reversion from a prior move exceeding 15%. Therefore, the prevailing phase is a downtrend, with current price action likely representing a temporary pause or minor bounce before potential further downside.
In the next 24 hours, Bitcoin/Tether may continue to testTST-- the 63,500 USDT support level. A break below this support could accelerate downside risk, while a sustained move above 64,000 USDT would be required to signal a potential shift in momentum.

Decoding market patterns and unlocking profitable trading strategies in the crypto space
Latest Articles
Stay ahead of the market.
Get curated U.S. market news, insights and key dates delivered to your inbox.


AInvest
PRO
AInvest
PRO




Comments
No comments yet