
Bitcoin's Falling Wedge and Measured Move Potential: A Strategic Breakout Play


In the evolving landscape of digital assets, Bitcoin's price action in 2025 has painted a compelling narrative of consolidation and potential breakout. The formation of a falling wedge pattern—a bullish reversal structure—has emerged as a focal point for traders and institutional investors alike. This pattern, coupled with macroeconomic tailwinds and on-chain dynamics, suggests a strategic opportunity for positioning ahead of a measured move toward $119,484 or higher.
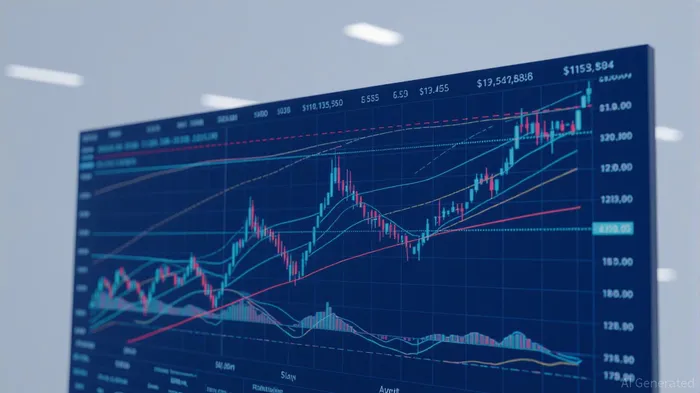
Technical Validation: The Falling Wedge and Volume Dynamics
A falling wedge is defined by two converging downward-sloping trendlines, with lower highs and lower lows that narrow over time. In Bitcoin's case, this pattern has been forming since mid-2024, with the price oscillating between $98,000 and $124,500. The narrowing range reflects waning bearish momentum and a critical shift in market psychology.
The wedge's validity hinges on volume behavior. During the consolidation phase, volume has steadily declined, signaling diminishing selling pressure. However, recent data shows a surge in volume as BitcoinBTC-- tests the upper trendline, a key indicator of buyer participation. A confirmed breakout—defined as a sustained close above the wedge's upper boundary—would be reinforced by a sharp spike in volume, validating the pattern's integrity.
Using the measured move method, the wedge's width (the distance between the highest high and lowest low) is projected from the breakout point. With the pattern's apex at $113,507 and a width of $26,500, the target is calculated by extending this range upward from the breakout level. If Bitcoin breaks above $119,484 on strong volume, the measured move suggests a potential rally to $146,000, aligning with historical wedge patterns in bull cycles.
Macroeconomic Catalysts: Policy Shifts and Liquidity Expansion
The Federal Reserve's anticipated dovish pivot in September 2025 adds a critical layer of support. A 25-basis-point rate cut, priced into markets via the CME FedWatch Tool, would boost liquidity and risk appetite, historically favorable for Bitcoin. Unlike 2021, when tightening monetary policy pressured risk assets, the current environment features elevated global money supply growth (M2), which has expanded by 12% year-to-date. This liquidity infusion could amplify Bitcoin's response to a breakout, as seen in past cycles where rate cuts coincided with multi-month rallies.
Moreover, Bitcoin's correlation with traditional assets has weakened, offering a unique hedge against macroeconomic uncertainty. As central banks grapple with inflation and growth imbalances, Bitcoin's role as a store of value and inflation hedge becomes increasingly attractive. This dynamic is underscored by the surge in Digital AssetDAAQ-- Treasuries (DATs), with public treasuries holding 951K BTC as of August 2025.
On-Chain and Institutional Flows: Accumulation and Positioning
On-chain metrics reinforce the bullish case. The Accumulation Trend Score, which measures buying pressure from long-term holders, has risen to 0.45 from 0.20 in July, indicating renewed accumulation. Meanwhile, the MVRV Z-Score of 2.667 suggests the market is in an early expansion phase, with profits still available for realization.
Institutional flows further validate the setup. Exchange-Traded Products (ETPs) and DATs added 54K BTC and 72K BTC in July alone, reflecting sustained demand. Large players, including MicroStrategy and Marathon Digital, have continued accumulating, purchasing $51.4 million in Bitcoin during a single week. This institutional confidence contrasts with retail bearishness, as evidenced by a put/call imbalance of -0.42 in August—the lowest since June 2023.
Risk Management: Key Levels and Contingency Planning
While the case for a breakout is strong, prudence is essential. Immediate support levels at $110,000 and $112,000 must hold to prevent a retest of the wedge's lower boundary. A breakdown below $111,982 (the wedge's neckline) would invalidate the bullish thesis, potentially triggering a decline toward $105,000–$108,000.
Traders should also monitor the 50-day exponential moving average (EMA) at $94,750, a critical psychological floor. A sustained close below this level could reignite the 2021-style correction, testing $98,000–$100,000. However, the broader macroeconomic environment—particularly the Fed's rate cut—provides a buffer against deeper declines.
Investment Strategy: Positioning for the Breakout
For strategic positioning, investors should consider entering long positions near the wedge's upper trendline ($119,484) with a stop-loss below $111,982. A trailing stop at 5% above the entry price can lock in gains while allowing for upside potential. Given the measured move target of $146,000, risk-reward ratios favor a bullish stance, particularly for those with a medium-term horizon.
Hedging strategies, such as purchasing call options or using leveraged ETFs, can amplify returns while capping downside risk. For conservative investors, a wait-and-see approach—confirming the breakout with volume and price action—remains prudent.
Conclusion: A Convergence of Forces
Bitcoin's falling wedge pattern, validated by volume dynamics and institutional flows, presents a compelling case for a strategic breakout trade. The convergence of technical consolidation, macroeconomic optimism, and on-chain accumulation creates a favorable environment for a measured move toward $119,484 and beyond. While risks remain—particularly from Fed policy surprises or a breakdown in key support levels—the interplay of these factors suggests a high-probability opportunity for investors willing to navigate the volatility.
As the market approaches the Jackson Hole symposium and the September rate decision, the coming weeks will be pivotal. Those who position with discipline and clarity may find themselves at the forefront of a new bull phase, where Bitcoin's technical and macroeconomic narratives align to redefine its trajectory.
Decoding blockchain innovations and market trends with clarity and precision.
Latest Articles
Stay ahead of the market.
Get curated U.S. market news, insights and key dates delivered to your inbox.


Comments
No comments yet