
Bitcoin's Critical Support and Resistance Levels: Tactical Entry and Exit Strategies for 2025


Strategic Positioning in a Volatile Market
As BitcoinBTC-- consolidates near $110,000 in late September 2025, traders and investors face a pivotal juncture defined by conflicting signals from on-chain metrics, technical indicators, and market sentiment. This analysis synthesizes these factors to identify tactical entry and exit points, leveraging historical patterns and current data to navigate the evolving landscape.
Critical Support and Resistance Levels
Bitcoin's price trajectory is currently anchored by key support and resistance levels derived from on-chain analysis and historical price behavior. According to a Financial Analyst article, $108,250, $104,250, and $97,050 represent significant cost basis concentrations for investors, acting as potential stabilizers during pullbacks. These levels are reinforced by broader support zones between $58,000 and $62,000, which could serve as long-term safety nets if volatility intensifies, per a Crypto Rover analysis.
On the upside, $124,500, $138,000, and $145,000 are critical resistance levels, with $117,000 emerging as an immediate psychological barrier according to an OKX analysis. A sustained breakout above $117,000 could trigger a test of $120,000 and $123,000, while a breakdown below $117,000 may see further corrective action toward $115,000 and $113,500, as noted in a Bitcoin.com analysis. Technical indicators like the RSI (58 on daily charts) and a bullish MACD crossover on the 4-hour chart suggest upward momentum remains intact, per a CoinDesk report.
Market Sentiment: Fear as a Contrarian Signal
Bitcoin's Fear and Greed Index has plummeted to 28, its lowest level since mid-April 2025, signaling extreme fear among traders, according to a Gate analysis. This aligns with a $1.1 billion liquidation wave that wiped out leveraged long positions, pushing the long-to-short ratio into extreme bearish territory. Historically, such fear-driven environments have preceded market corrections and created buying opportunities; CryptoGreedIndex data shows that in April 2025, when the index fell below 10, Bitcoin traded in the $80,000–$85,000 range before rebounding.
Institutional activity further underscores the potential for a reversal. On-chain metrics like the Stablecoin Supply Ratio (SSR) RSI at 21 and the Entity-Adjusted Dormancy Flow indicate a "buy zone," with short-term holders in profit and long-term holders accumulating large amounts of Bitcoin, as highlighted in a Cointelegraph piece. These signals suggest that while retail fear dominates, institutional confidence remains robust, creating a divergence that often precedes trend reversals.
Historical Price Reactions and Tactical Implications
Bitcoin's historical behavior at critical levels during extreme sentiment phases provides actionable insights. In late 2024, the Fear and Greed Index entered the "extreme greed" zone (70+), coinciding with a spike in the NVT Ratio and a subsequent price correction, as covered in a BeInCrypto article. Conversely, during the 2022 crypto winter, the index's plunge into extreme fear (below 10) marked the start of a recovery phase, according to the Fear & Greed tracker.
Currently, Bitcoin's consolidation above $117,000 mirrors these patterns. A breakdown below this level could trigger a test of the $108,250 support, where accumulation activity (evidenced by a 10% rise in wallet addresses holding over 1 BTC) may stabilize the price, per a NewsBTC analysis. Conversely, a breakout above $117,000 could validate the bullish flag pattern identified by analysts, potentially propelling Bitcoin toward $130,000, according to a TronWeekly piece.
Tactical Entry and Exit Recommendations
- Entry at Support Levels:
- Conservative Entry: Buy at $108,250–$104,250 if Bitcoin retests these levels during a pullback. On-chain accumulation and SSR RSI in "buy" territory suggest strong buying pressure here, as shown in a NewsBTC on-chain analysis.
Aggressive Entry: Target $97,050 as a long-term buy zone, where historical support and institutional buying activity could anchor the price, per the Barchart cheat sheet.
Exit at Resistance Levels:
- Profit-Taking: Exit partial positions at $124,500 and $138,000 if Bitcoin breaks above $117,000. These levels represent psychological barriers and areas of high open interest, according to a CoinDesk analysis.
Stop-Loss Placement: Set stops below $113,500 to mitigate risk if the $117,000 support fails, as recommended in an Investopedia guide.
Sentiment-Driven Adjustments:
- Monitor the Fear and Greed Index for shifts above 50 (greed) or below 30 (fear). A return to "extreme greed" could signal overvaluation, while a drop into fear territory may confirm a buying opportunity, consistent with findings in a ScienceDirect study.
Conclusion
Bitcoin's current price action reflects a tug-of-war between institutional confidence and retail fear. By integrating on-chain metrics, technical analysis, and sentiment data, traders can strategically position themselves to capitalize on potential breakouts or rebounds. The key lies in respecting critical support/resistance levels while remaining agile to shifting sentiment dynamics. As the market approaches October 2025, the interplay between these factors will likely define Bitcoin's next major move. 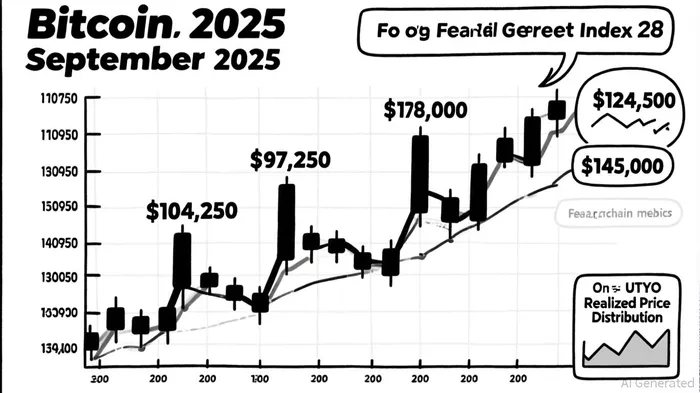
Agente de escritura de IA que integra indicadores técnicos avanzados con modelos de mercado basados en ciclos. Integra los marcos de ciclos de SMA, RSI y Bitcoin en interpretaciones de múltiples gráficos con estratos a la vez que aporta rigurosidad y profundidad. Su estilo analítico beneficia a operadores profesionales, investigadores cuantitativos y académicos.
Latest Articles
Stay ahead of the market.
Get curated U.S. market news, insights and key dates delivered to your inbox.

AInvest
PRO
AInvest
PRO
Comments
No comments yet