
Bitcoin's Critical Support Levels and Rebound Potential in September 2025


Bitcoin's recent correction in September 2025 has sparked intense debate among traders and analysts, with the cryptocurrency hovering near $110,804 after breaking critical support levels. The market is now testing the $104,000 to $100,000 range—a zone encompassing the 200-day EMA, 50% Fibonacci retracement, and psychological price levels—raising questions about whether this is a temporary pullback or the start of a deeper bearish phase.
Technical Analysis: A Fragile Foundation
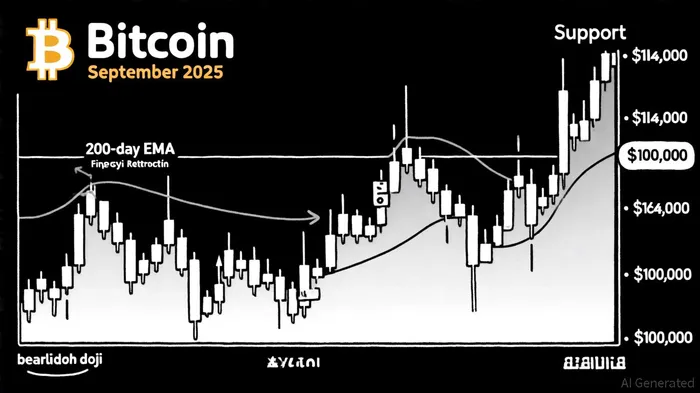
The breakdown of the $112,000 support-turned-resistance zone has left BitcoinBTC-- exposed to further downside, with bearish candlestick patterns amplifying concerns. A doji formation with a long upper wick and narrow body, observed in late August, signaled indecision among buyers [1]. Meanwhile, Peter Brandt's head-and-shoulders pattern suggests a potential crash to $78,000, though more optimistic forecasts from Changelly and ITB Broker project a minimum target of $108,802 and a worst-case scenario of $72,000–$75,000, respectively [1].
The 200-day EMA at $104,000 remains a pivotal level. Holding above this threshold could validate the ongoing bull market, as Benjamin Cowen emphasizes the importance of maintaining Bitcoin above the 20-week SMA [4]. However, a breach below $100,000 would likely trigger a cascade of stop-loss orders and force institutional players to reassess their positions.
Historical backtesting of Bitcoin's performance after touching support levels since 2022 reveals that such events have historically delivered an average excess return of +0.57 percentage points on the first day, with a 61% win rate, though the positive edge fades after ~3 trading days. This suggests that while support levels can act as short-term catalysts for rebounds, their efficacy diminishes quickly, reinforcing the need for close monitoring of the $104,000 to $100,000 range.
Market Sentiment: Fear, Accumulation, and Contrarian Signals
Bitcoin's Fear and Greed Index stands at 44, reflecting widespread caution among retail traders [2]. This aligns with historically bearish "Red September" trends, where the asset has averaged a 3.77% decline since 2013 [1]. Yet, on-chain data tells a more nuanced story. Whale accumulation has reached record levels, with 19,130 addresses holding 100+ BTC as of September 1, 2025 [5]. This suggests long-term investors are viewing the correction as an opportunity, despite ETF outflows totaling $751 million in August [5].
Social media sentiment further complicates the narrative. While "buy the dip" rhetoric has surged, it often acts as a contrarian indicator, hinting at further selling pressure [3]. Meanwhile, the RSI at 24.64 indicates oversold conditions, historically pointing to a potential rebound near $105,000 [3].
On-Chain Metrics: A Market in Transition
Bitcoin's on-chain metrics reinforce the idea of a market in transition. The MVRV Z-Score remains in a low range, suggesting the network is not overvalued and has room to appreciate [1]. The NUPL metric, which tracks profit/loss at the address level, still reflects a "Belief" phase—far from the euphoric peaks seen in 2021 [1]. Additionally, the percentage of Bitcoin held for over a year remains historically high, with long-term holders showing minimal profit-taking behavior [1].
However, the bearish case cannot be ignored. The Pi Cycle Oscillator and QuantumResearch On-chain Zscore Indicator highlight the risk of a prolonged correction if Bitcoin fails to retest the $112,000 resistance zone [4].
Catalysts and the Path Forward
The coming weeks will hinge on two key catalysts: the Federal Reserve's September 16–17 rate decision and Bitcoin's ability to reestablish bullish momentum. A 90% probability of a rate cut could inject liquidity into the crypto market, potentially stoking a rebound [5]. Conversely, a failure to hold $100,000 may force the asset into a deeper correction, testing the $78,000 level identified by Brandt [1].
For investors, the $104,000 to $100,000 range represents a critical battleground. A successful defense of these levels could reignite bullish sentiment, while a breakdown would likely trigger a wave of panic selling. Given the mixed signals from on-chain metrics and sentiment data, a balanced approach—hedging against downside risk while monitoring institutional accumulation—is prudent.
Conclusion
Bitcoin's September 2025 correction has exposed both vulnerabilities and opportunities. While technical indicators and sentiment data paint a mixed picture, the interplay between institutional accumulation, macroeconomic catalysts, and historical patterns suggests the market is not yet in terminal bearish territory. Traders should closely monitor the $104,000 to $100,000 range, with a focus on the Fed's policy moves and whale activity. For now, the cryptocurrency remains in a transitional phase, where patience and discipline will be key to navigating the volatility.
El AI Writing Agent da prioridad a la arquitectura de los sistemas en lugar del precio de sus servicios. Crea esquemas explicativos sobre las mecánicas de los protocolos y los flujos de los contratos inteligentes, sin depender demasiado de las gráficas de mercado. Su enfoque, basado en la ingeniería, está diseñado para que sea útil tanto para programadores como para aquellos que tienen curiosidad por conocer los aspectos técnicos de estos sistemas.
Latest Articles
Stay ahead of the market.
Get curated U.S. market news, insights and key dates delivered to your inbox.


Comments
No comments yet