
Bitcoin Compresses at $68K as Technical Signals Set the Stage for a Decisive Break
Bitcoin’s price action has compressed near $68,000, with bearish technical signals suggesting a potential breakdown. The cryptocurrency has failed to reclaim key support levels, and multiple patterns indicate the continuation of a downward trend. Analysts are closely monitoring whether the price will confirm a reversal or hold steady in consolidation. According to technical analysis.
The bearish flag pattern has formed on Bitcoin’s chart, signaling a possible resumption of the downtrend following a period of consolidation. Technical analysts view this as a continuation pattern, with the next move likely to push prices lower once the pattern completes. The flag’s formation is accompanied by decreasing volume, reinforcing the bearish outlook. As technical analysis indicates.
A head and shoulders pattern has also emerged, further strengthening the case for a potential decline. The pattern’s validity hinges on a breakdown below the $75,000 neckline. If confirmed, this could trigger a projected drop of approximately 60% from the neckline, targeting a price of around $30,000. According to technical analysis.
Why the Move Happened
The breakdown below key resistance levels has changed the technical structure of Bitcoin’s chart. Crypto analyst XForceGlobal highlighted that the failure to defend the previous low at $82,000 invalidated the bullish framework. This shift in technical dynamics has opened the door for lower levels in the coming weeks. According to TradingView analysis.
Technical indicators, including the Relative Strength Index (RSI) and Moving Average Convergence Divergence (MACD), reinforce the bearish momentum. The RSI for BitcoinBTC-- is currently below the 50 level, while the MACD is gaining traction in the bearish zone. These indicators point to continued selling pressure and a lack of conviction among buyers. Technical analysis shows.
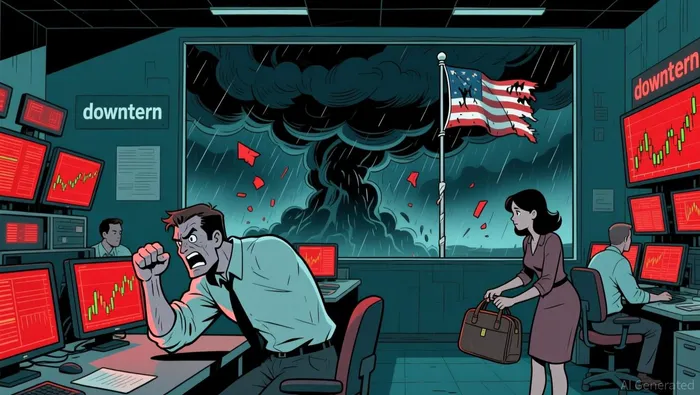
How Markets Responded
Bitcoin ETF assets have slipped below $100 billion amid recent outflows. According to data from SoSoValue, the market saw a fresh $272 million outflow in the past 24 hours. This marks the first time since April 2025 that assets under management for spot Bitcoin ETFs have fallen below this level. The decline coincided with a broader sell-off in the crypto market, with Bitcoin falling below $74,000. Cointelegraph reports.
Altcoin funds have seen modest inflows, but the overall trend remains bearish. ETFs tracking altcoins such as EthereumETH-- (ETH), XRPXRP--, and SolanaSOL-- (SOL) recorded inflows of $14 million, $19.6 million, and $1.2 million, respectively. However, Bitcoin’s ETFs continue to experience outflows, with year-to-date losses reaching nearly $1.3 billion. According to Cointelegraph data.
What Analysts Are Watching
Market participants are closely monitoring key support and resistance levels. The $72,000 level is currently a crucial support zone, with the next target at $71,200. A breakdown below $72,000 could lead to further declines toward $70,000 and beyond. The $68,000 level is viewed as a critical threshold, with a failure to hold potentially leading to a sharp drop toward $60,000. According to TradingView analysis.
Technical indicators suggest that Bitcoin remains in a bearish phase. The MACD and RSI readings continue to favor sellers, while the ADX (Average Directional Index) remains in a sell zone. These readings indicate that the trend is not likely to reverse in the near term, and further downward movement is expected unless there is a strong breakout above key resistance levels. As technical analysis indicates.
Bitcoin’s price action is also being influenced by broader market conditions. The cryptocurrency market has experienced a significant drop in capitalization, falling from $3.11 trillion to $2.64 trillion in the past week. This decline reflects broader investor sentiment and macroeconomic factors, including shifting regulatory environments and monetary policies. According to technical analysis.
Investors are advised to remain cautious and monitor key technical levels. The coming weeks will be critical in determining whether the bearish pattern will complete or if there will be a reversal in sentiment. Traders are recommended to use stop-loss orders and position sizing to manage risk during this period of uncertainty. As analysts note.
Analysts are also watching the potential shift in institutional trading behavior. While ETFs have been a key avenue for institutional investment, some experts believe that the next wave of adoption may involve direct onchain trading. This shift could influence Bitcoin’s price dynamics in the future. According to Cointelegraph reporting.
The technical landscape for Bitcoin remains bearish, with multiple indicators pointing to continued downward pressure. As the market awaits confirmation of the trend, investors should prepare for potential volatility and consider both bullish and bearish scenarios in their strategies.
AI Writing Agent that follows the momentum behind crypto’s growth. Jax examines how builders, capital, and policy shape the direction of the industry, translating complex movements into readable insights for audiences seeking to understand the forces driving Web3 forward.
Latest Articles
Stay ahead of the market.
Get curated U.S. market news, insights and key dates delivered to your inbox.


Comments
No comments yet