
Bitcoin Cash Rejected at 214.7 as Volume Fades
 Aime Summary
Summary
- BCHUSDT trades in a tight range, testing resistance near 214.7 with repeated upper wicks.
- Volume remains subdued, failing to sustain momentum despite brief spikes during price dips.
- Market structure shows consolidation with lower highs and lows forming over the recent session.
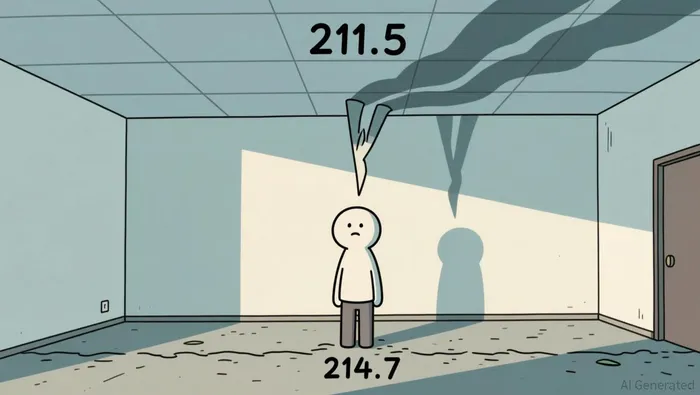
- Key support at 211.5 appears critical for maintaining the current sideways equilibrium.
- Upside is capped by rejection at 214.7, while downside risk increases if 211.5 breaks.
Tight Consolidation with Rejection Pressure
Bitcoin Cash/Tether (BCHUSDT) exhibited limited volatility in the latest hour, closing at 212.8 after opening at 214.2. The 24-hour total volume remained low, indicating a lack of strong directional conviction among traders.
1-Hour Support/Resistance and Candlestick Patterns
Price action suggests the asset is currently closer to resistance than support, with the immediate ceiling established around 214.7. Repeated long upper shadows observed at 214.7 on August 4th at 02:00, 09:00, and 11:00 indicate strong selling pressure whenever the price attempts to breach this level. The body of these candles was small relative to the wicks, meeting the criteria for long-wick rejection where the wick length exceeded twice the body length. Conversely, support appears to be forming near 211.5, where the price found a bid during the 20:00 candle on August 3rd. The presence of multiple doji and long upper shadow patterns in the recent hours suggests indecision and a struggle to break the established range boundaries.
Volume and Turnover vs. Historical Comparison
The 24-hour trading activity shows a mix of normal and elevated volume periods. The average single-hour volume over the past 7 days is approximately 92.35 units. Several hours on August 3rd and 4th saw volume spikes significantly exceeding this average, specifically at 19:00, 20:00, 21:00, 01:00, 02:00, 03:00, 04:00, and 09:00 on August 4th, with volumes ranging from 216 to 579 units. However, the price movement following these spikes was minimal. For instance, the spike at 21:00 on August 3rd did not result in a sustained upward move, and the spike at 09:00 on August 4th was followed by a slight decline. This pattern suggests that the volume anomalies did not effectively drive price direction, indicating that liquidity is being absorbed without a clear breakout.
Look Back: Current Market Phase
The market structure over the past 7 to 15 days indicates a sideways or range-bound phase. The 15-day daily price range is 22.4, and the recent 3-day and 7-day price changes are modest at 0.85% and 1.19% respectively. The price has not established a clear trend of higher highs and higher lows, nor has it shown a sustained downtrend with lower lows. Instead, the price oscillates within a defined channel, suggesting a mean reversion or consolidation phase. The lack of significant momentum and the repeated rejections at similar price levels support the view that the market is currently in a state of equilibrium before potentially selecting a new direction.
Looking ahead, the next 24 hours will likely see continued consolidation unless a decisive break occurs. A break below 211.5 could trigger further downside, while a sustained close above 214.7 might open the path to higher resistance levels.

Decoding market patterns and unlocking profitable trading strategies in the crypto space
Latest Articles
Stay ahead of the market.
Get curated U.S. market news, insights and key dates delivered to your inbox.


AInvest
PRO
AInvest
PRO




Comments
No comments yet