
Bitcoin Cash Gains 0.6% on Weak Volume, Raising Bull Trap Fears
Bitcoin Cash (BCH) closed at $460.90 on March 21, 2026, reflecting a 0.61% increase in the past 24 hours. However, the price remains 22.37% lower than a year ago and has declined 1.13% over the last seven days. The short-term gain masks deeper concerns in the market, as technical indicators suggest limited buyer participation and a growing distribution risk.
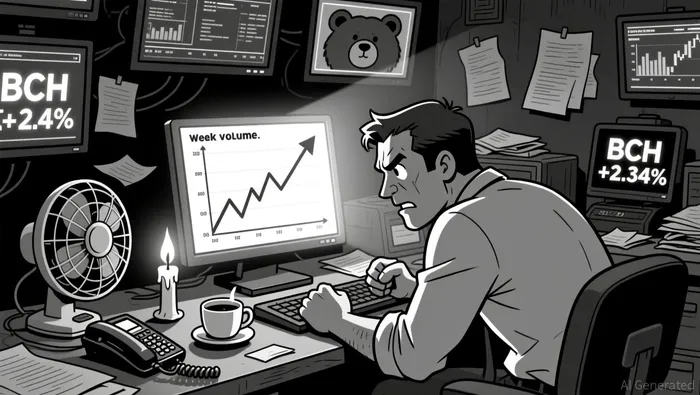
Weak Volume Profile and Market Participation
 BCH's 24-hour trading volume totaled $165.56 million, which is approximately 20% below its 7-day average. This low volume fails to support the recent 2.34% price increase to $471.80, signaling weak market conviction and limited institutional involvement. In the volume profile, the Value Area High (VAH) is clustered around $475, while the Point of Control (POC) is near the $470 support level. These levels indicate that buying pressure is thin and that sellers continue to dominate the price action.
Upward candle volumes have accounted for only 55% of total volume over the last 24 hours, further reinforcing the idea that bullish momentum is not being backed by sufficient liquidity. Typically, a healthy uptrend is supported by increasing volume as prices rise; in this case, the opposite is true, raising the risk of a bull trap.
Accumulation Signals and Distribution Pressures
While BCH is currently above the 20-day Exponential Moving Average (EMA20) at $469.02—a short-term bullish sign—the volume does not align with this positive technical setup. The MACD histogram has turned positive, suggesting some accumulation, but the RSI at 48.65 remains neutral. On-chain data shows limited whale accumulation, and the POC has not shifted toward key support levels as would be expected in a forming accumulation phase.
Conversely, distribution signals are more pronounced. The current rally on weak volume is reminiscent of a classic Wyckoff distribution pattern. Resistance levels at $475.54 and $491.46 are being rejected with minimal volume, and multi-timeframe analysis reveals a dominance of resistance levels (9R vs. 5S), indicating strong bearish control. Volume has not increased on declining price action, which is a healthy sign for a bear market.
Price-Volume Divergence and Long-Term Outlook
The most concerning signal is the divergence between price and volume. Despite a 2.34% rise, volume remains below average, which contradicts the typical behavior of a healthy uptrend. This divergence suggests that the current price action is not backed by strong market participation and that the bearish downtrend may continue.
For a bullish flip to occur, volume at the $470 support level must rise significantly. If it does not, the $355 price target becomes more likely. Longer-term, a shift in the POC toward accumulation levels is necessary for a sustainable price recovery, but the current profile shows sideways simplification rather than consolidation.
Strategic Implications for Traders
Given the current volume-based analysis, a cautious approach is warranted. A short-term test of $475–$491 should be accompanied by a volume increase above $200 million. If that fails to materialize, a breakdown below $470 could signal a bearish continuation toward $355. Traders are advised to take a short bias unless volume confirms a bullish reversal.
Correlation with Bitcoin
BCH remains highly correlated with BitcoinBTC-- (correlation coefficient of 0.85+). While Bitcoin is stable at $70,737, BCH is outperforming. A breakdown in Bitcoin below $70,000 could drag BCH toward $355, while a breakout above $72,000 could set a $575 price target. However, volume confirmation will be key to validate any potential trend reversal.
Delivering real-time analysis and insights on unexpected cryptocurrency price movements to keep traders ahead of the curve.
Latest Articles
Stay ahead of the market.
Get curated U.S. market news, insights and key dates delivered to your inbox.

AInvest
PRO
AInvest
PRO
Comments
No comments yet