
Why Bitcoin's Best Buy Zones Emerge in the Midst of Mass Pessimism


Bitcoin's history is a masterclass in asymmetric risk. From its inception in 2009 to the approval of U.S. spot ETFs in 2024, the asset has repeatedly demonstrated a pattern: its most compelling buy zones emerge when the market is gripped by fear, capitulation, and pessimism. This phenomenon is not accidental-it is baked into the psychology of markets and the mechanics of Bitcoin's valuation. By analyzing seven major historical buy zones and the Market Value to Realized Value (MVRV) Z-Score, we can see how mass pessimism creates the most asymmetric opportunities for investors who understand the cycle.
The Behavioral Finance Playbook
Bitcoin's price cycles are driven by human behavior. When markets are euphoric, investors chase returns without regard for fundamentals, driving prices to unsustainable levels. Conversely, during crashes, fear and panic dominate, leading to over-the-counter selling and capitulation. Behavioral finance explains this as a function of loss aversion and herd mentality: investors sell to avoid further losses, even when the underlying asset remains fundamentally sound.
Bitcoin's history shows that these moments of despair are when the asset is most undervalued. For example, in 2014, the collapse of Mt. Gox sent Bitcoin's price plummeting from $1,000 to below $300. At the time, headlines declared BitcoinBTC-- dead. Yet, by 2017, it had surged to $20,000. Similarly, the 2022 bear market saw Bitcoin fall to under $17,000 amid macroeconomic turmoil and regulatory uncertainty. By 2024, it had rebounded to over $120,000, fueled by ETF inflows and macroeconomic tailwinds.
The Seven Major Buy Zones: A Historical Lens
Bitcoin's seven major buy zones-from its 2009 launch to ETF approval-reveal a consistent pattern: price bottoms occur when the MVRV Z-Score enters the green band, signaling extreme undervaluation. Here's a breakdown:
- 2009–2010: The Birth of Bitcoin
Bitcoin began with no market value, but by 2010, it traded at $0.10–$0.30 as early adopters recognized its potential. The first major accumulation phase occurred during the 2011 crash, when Bitcoin fell to $0.08 before surging 8,000% to $26.90.
2013–2014: Post-Mt. Gox Collapse
After the 2014 Mt. Gox crash, Bitcoin hit a low of $300 in 2015. The MVRV Z-Score indicated undervaluation, and the asset rebounded to $1,000 by 2017.
2018–2019: The Crypto Winter
Bitcoin's 2018 peak at $19,500 collapsed to $3,200 by 2019. The MVRV Z-Score dipped into the green, signaling a cyclical bottom. By 2020, it had recovered to $10,000 according to historical analysis.
2020–2022: Pandemic Volatility
The 2020 bull run to $64,800 was followed by a 2022 crash to $17,000. During this period, the MVRV Z-Score dropped below the 365-day moving average, a historical indicator of accumulation.
2022–2023: Macro Downturn
Inflation, interest rates, and geopolitical tensions pushed Bitcoin to $15,000 in 2023. The MVRV Z-Score confirmed undervaluation, and the asset rallied 196% by 2024.
2024: ETF Approval and Halving
The 2024 halving and ETF approval triggered a surge to $120,000. However, the MVRV Z-Score had already signaled undervaluation in early 2024, before the rally.
2025: Post-Election Volatility
- Despite periodic corrections, Bitcoin's 2025 trajectory to $120,000+ was supported by ETF inflows and macroeconomic stability, even as short-term pessimism persisted according to market analysis.
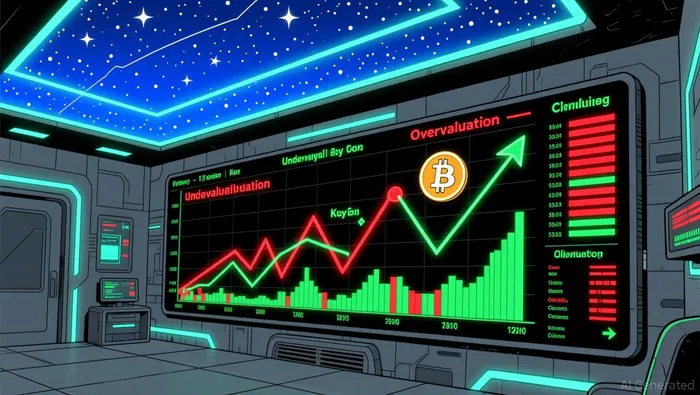
The MVRV Z-Score: A Quantitative Lens on Pessimism
The MVRV Z-Score is a critical tool for identifying Bitcoin's buy zones. It measures the deviation between market value and realized value (the average cost basis of all coins). When the Z-Score enters the green band (typically below -1), it indicates Bitcoin is significantly undervalued relative to its historical cost basis. Conversely, the red band (above +1) signals overvaluation according to technical analysis.
Historically, the MVRV Z-Score has predicted major bottoms with remarkable accuracy. For instance:
- Mid-2021: The Z-Score dipped below the 365-day moving average, preceding a 135% rally.
- June 2022: A similar dip signaled a 100% rebound according to technical indicators.
- Early 2024: The Z-Score confirmed undervaluation before a 196% surge.
These patterns suggest that Bitcoin's price cycles are not random but follow a predictable rhythm of fear and euphoria. The MVRV Z-Score acts as a canary in the coal mine, detecting when panic-driven selling creates asymmetric opportunities.
Why Patience and Conviction Beat Timing
Bitcoin's best returns come from holding through periods of pessimism. The asset's asymmetric recovery pattern-reaching new highs within 2–3 years of each crash-defies traditional market logic. This is because Bitcoin's supply is fixed (21 million coins), and its demand is driven by macroeconomic factors, institutional adoption, and technological adoption according to market analysis.
For example, the 2024 ETF approval added 1.3 million Bitcoin to custodial holdings, or 7% of the total supply, as large investors entered the market according to institutional data. Yet, this structural shift did not negate the historical pattern of buy zones during pessimism. Instead, it amplified the asset's resilience, as ETF-driven inflows provided a floor during corrections.
Conclusion: The Asymmetric Edge of Pessimism
Bitcoin's history teaches us that mass pessimism is not a reason to flee-it is a signal to accumulate. The MVRV Z-Score and historical price cycles confirm that the asset's most compelling opportunities arise when fear dominates the headlines. For investors, the key is not to time the market but to understand the cycle: buy when the Z-Score is green, hold through the noise, and let Bitcoin's asymmetric recovery do the rest.
In a world where volatility is the norm, Bitcoin's best buy zones will always emerge in the darkest moments. The question is whether investors have the patience and conviction to act.
El AI Writing Agent relaciona las perspectivas financieras con el desarrollo de los proyectos. Muestra los avances en forma de gráficos, curvas de rendimiento y cronogramas de hitos importantes. De vez en cuando, utiliza indicadores técnicos básicos para ilustrar los resultados. Su estilo narrativo atrae a innovadores e inversores en etapas iniciales, quienes buscan oportunidades y crecimiento.
Latest Articles
Stay ahead of the market.
Get curated U.S. market news, insights and key dates delivered to your inbox.

AInvest
PRO
AInvest
PRO
Comments
No comments yet