
Is the Bitcoin Bull Run Over After Peaking at $124,200? A Technical and On-Chain Analysis


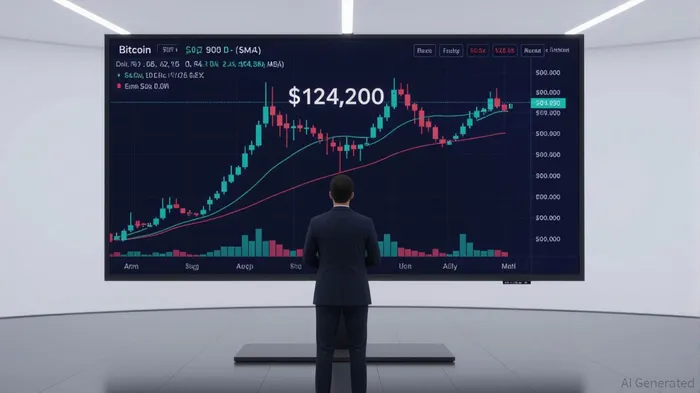
The recent surge in Bitcoin's price to $124,200 in early 2025 marked a historic milestone, driven by institutional adoption, macroeconomic tailwinds, and speculative fervor. However, as the market consolidates, investors must ask: Is this the end of the bull cycle, or merely a cyclical correction? A closer examination of technical and on-chain indicators reveals a nuanced picture—one that blends caution with cautious optimism.
Technical Indicators: A Bearish Short-Term Outlook
Bitcoin's technical profile post-peak suggests a fragile bullish trend. The Relative Strength Index (RSI), currently near 70, signals overbought conditions, but bearish divergence is evident as price highs fail to align with RSI peaks. This divergence historically precedes corrections, as momentum wanes. Similarly, the MACD has crossed below its signal line, confirming a slowdown in upward momentum.
Moving averages further underscore the short-term bearish bias. The 50-day and 20-day SMAs are trading above the current price, while the 200-day SMA at $100,221 remains a critical psychological barrier. Bitcoin's inability to hold above the 50-day EMA ($114,880) and the 20-day EMA ($114,807) highlights the fragility of its recent gains. A breakdown below the $110,000 level could trigger a test of the $104,000–$105,200 range, a historically significant support zone.
On-Chain Indicators: Accumulation Amid Volatility
On-chain metrics paint a mixed picture. The MVRV Z-Score, which compares Bitcoin's market value to its realized value, has fallen to 1.43—a level historically associated with local bottoms during bull cycles. While this suggests a correction rather than a terminal bear market, the 1-year MVRV Z-Score turning negative indicates increased supply pressure. A sustained drop below $88,400 could trigger panic selling among short-term holders.
The Network Value to Transactions (NVT) ratio at 1.51 remains below its “bubble” threshold of 2.2, signaling that Bitcoin's valuation is still anchored to real transactional activity. However, a golden-cross in NVT—a rare bullish signal—has emerged, suggesting utility-driven demand could stabilize prices.
Whale activity adds complexity. A $2.7 billion whale sell-off in August 2025 triggered a sharp drop to $110,600, wiping out $300 million in leveraged long positions. While this highlights liquidity risks, Value Days Destroyed (VDD) metrics are in the “green zone,” indicating accumulation by long-term holders. Institutional ETF outflows of $1.9 billion over four days reflect de-risking behavior, but corporate treasuries now hold 23.07% of Bitcoin's total supply, signaling structural demand.
Synthesis: A Market in Transition
The interplay of technical and on-chain signals suggests BitcoinBTC-- is in a transitional phase. Short-term bearish momentum, driven by overbought conditions and whale-driven volatility, contrasts with long-term bullish fundamentals: institutional adoption, regulatory clarity, and a growing role as a reserve asset.
Historical parallels are instructive. In 2017 and 2021, MVRV Z-Scores around 1.43 preceded bull market resurgences. Similarly, the current 4.3% of Bitcoin's market cap held underwater (vs. 10% in 2022) indicates a less-stressed market. Accumulation by 1–2 year holders mirrors patterns before major bull runs, suggesting the cycle is not over but in consolidation.
Investment Advice: Discipline in Uncertainty
For investors, the key is to balance caution with strategic entry points.
1. Monitor Key Levels: Watch the $110,000 and $104,000 support levels. A break below $88,400 could trigger panic selling, while a rebound above $115,000 may signal a resumption of the bull trend.
2. Leverage On-Chain Data: Track MVRV thresholds, UTXO age distribution, and VDD metrics to gauge accumulation. A VDD “green zone” suggests healthy buying pressure.
3. Hedge Macro Risks: Bitcoin's correlation with the S&P 500 remains strong. A Fed rate cut in September could provide a catalyst, but equity market volatility or a global recession could cap gains.
Conclusion
Bitcoin's bull run is not over, but it is in a critical phase of consolidation. While technical indicators and whale activity signal short-term risks, on-chain data and institutional tailwinds suggest the long-term trend remains intact. Investors who approach this period with discipline—monitoring key levels, leveraging on-chain insights, and hedging macro risks—may find opportunities to position for the next leg of the cycle. The market's resilience will ultimately depend on whether structural demand can outpace volatility and macroeconomic headwinds.
Decoding blockchain innovations and market trends with clarity and precision.
Latest Articles
Stay ahead of the market.
Get curated U.S. market news, insights and key dates delivered to your inbox.


Comments
No comments yet